Process forecasting
Overview
Process forecasting uses existing cases, usually completed ones, and the current process model to estimate the remaining time for incomplete cases. It calculates KPIs including the reference dataset's average throughput time, the target dataset's current throughput time, and the predicted average throughput time at completion.
Features
Prerequisites
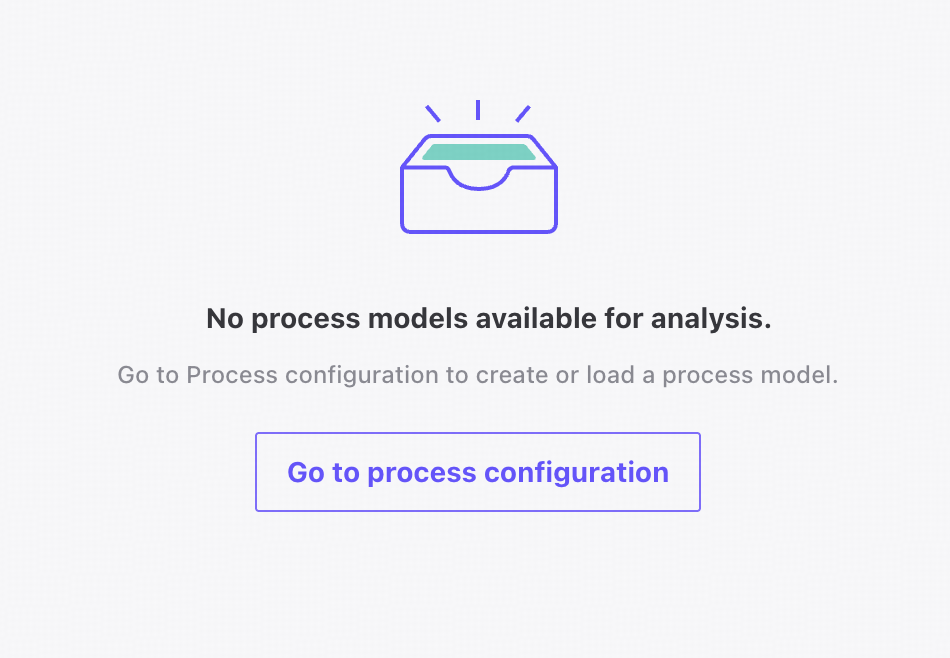
Before forecasting, configure and load a business process model. If no model is loaded, click Go to process configuration to configure one.
Overview
Create process forecasts and manage saved forecast records from the overview.
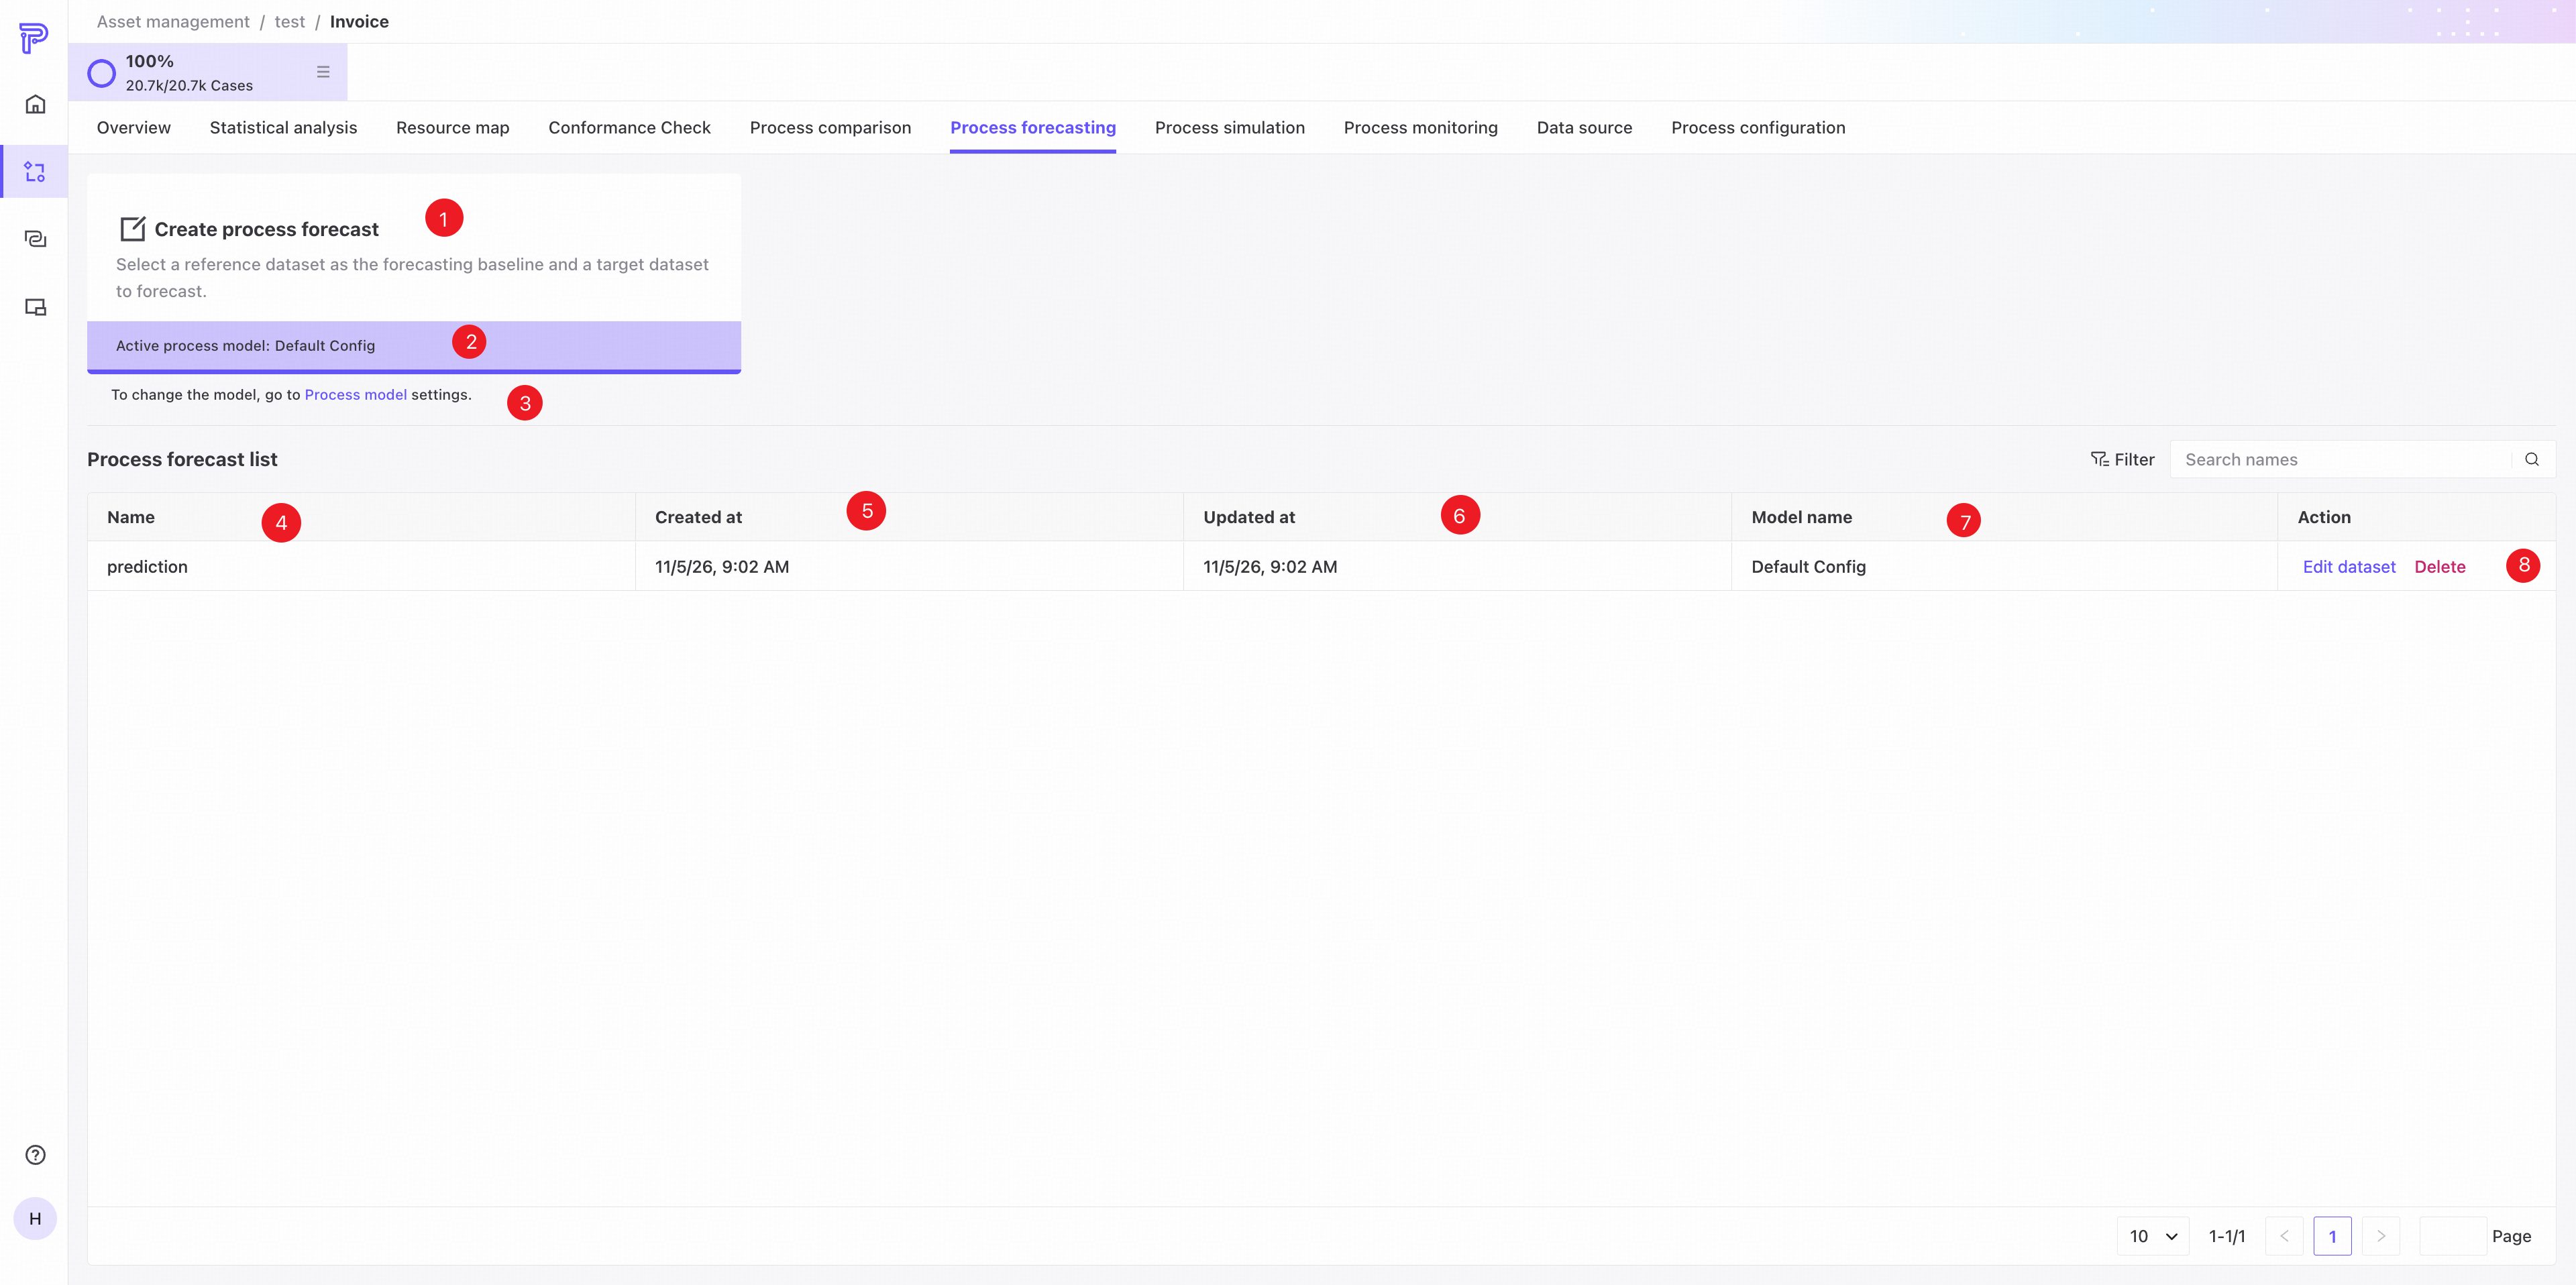
❶ Click the card to create a process forecast.
❷ The name of the active process model.
❸ Open process model configuration.
❹ Process forecast name.
❺ Creation time.
❻ Update time.
❼ Active model.
❽ Actions: edit the datasets or delete the forecast.
Create a process forecast
Select datasets
Click the Create process forecast card to open the creation page.
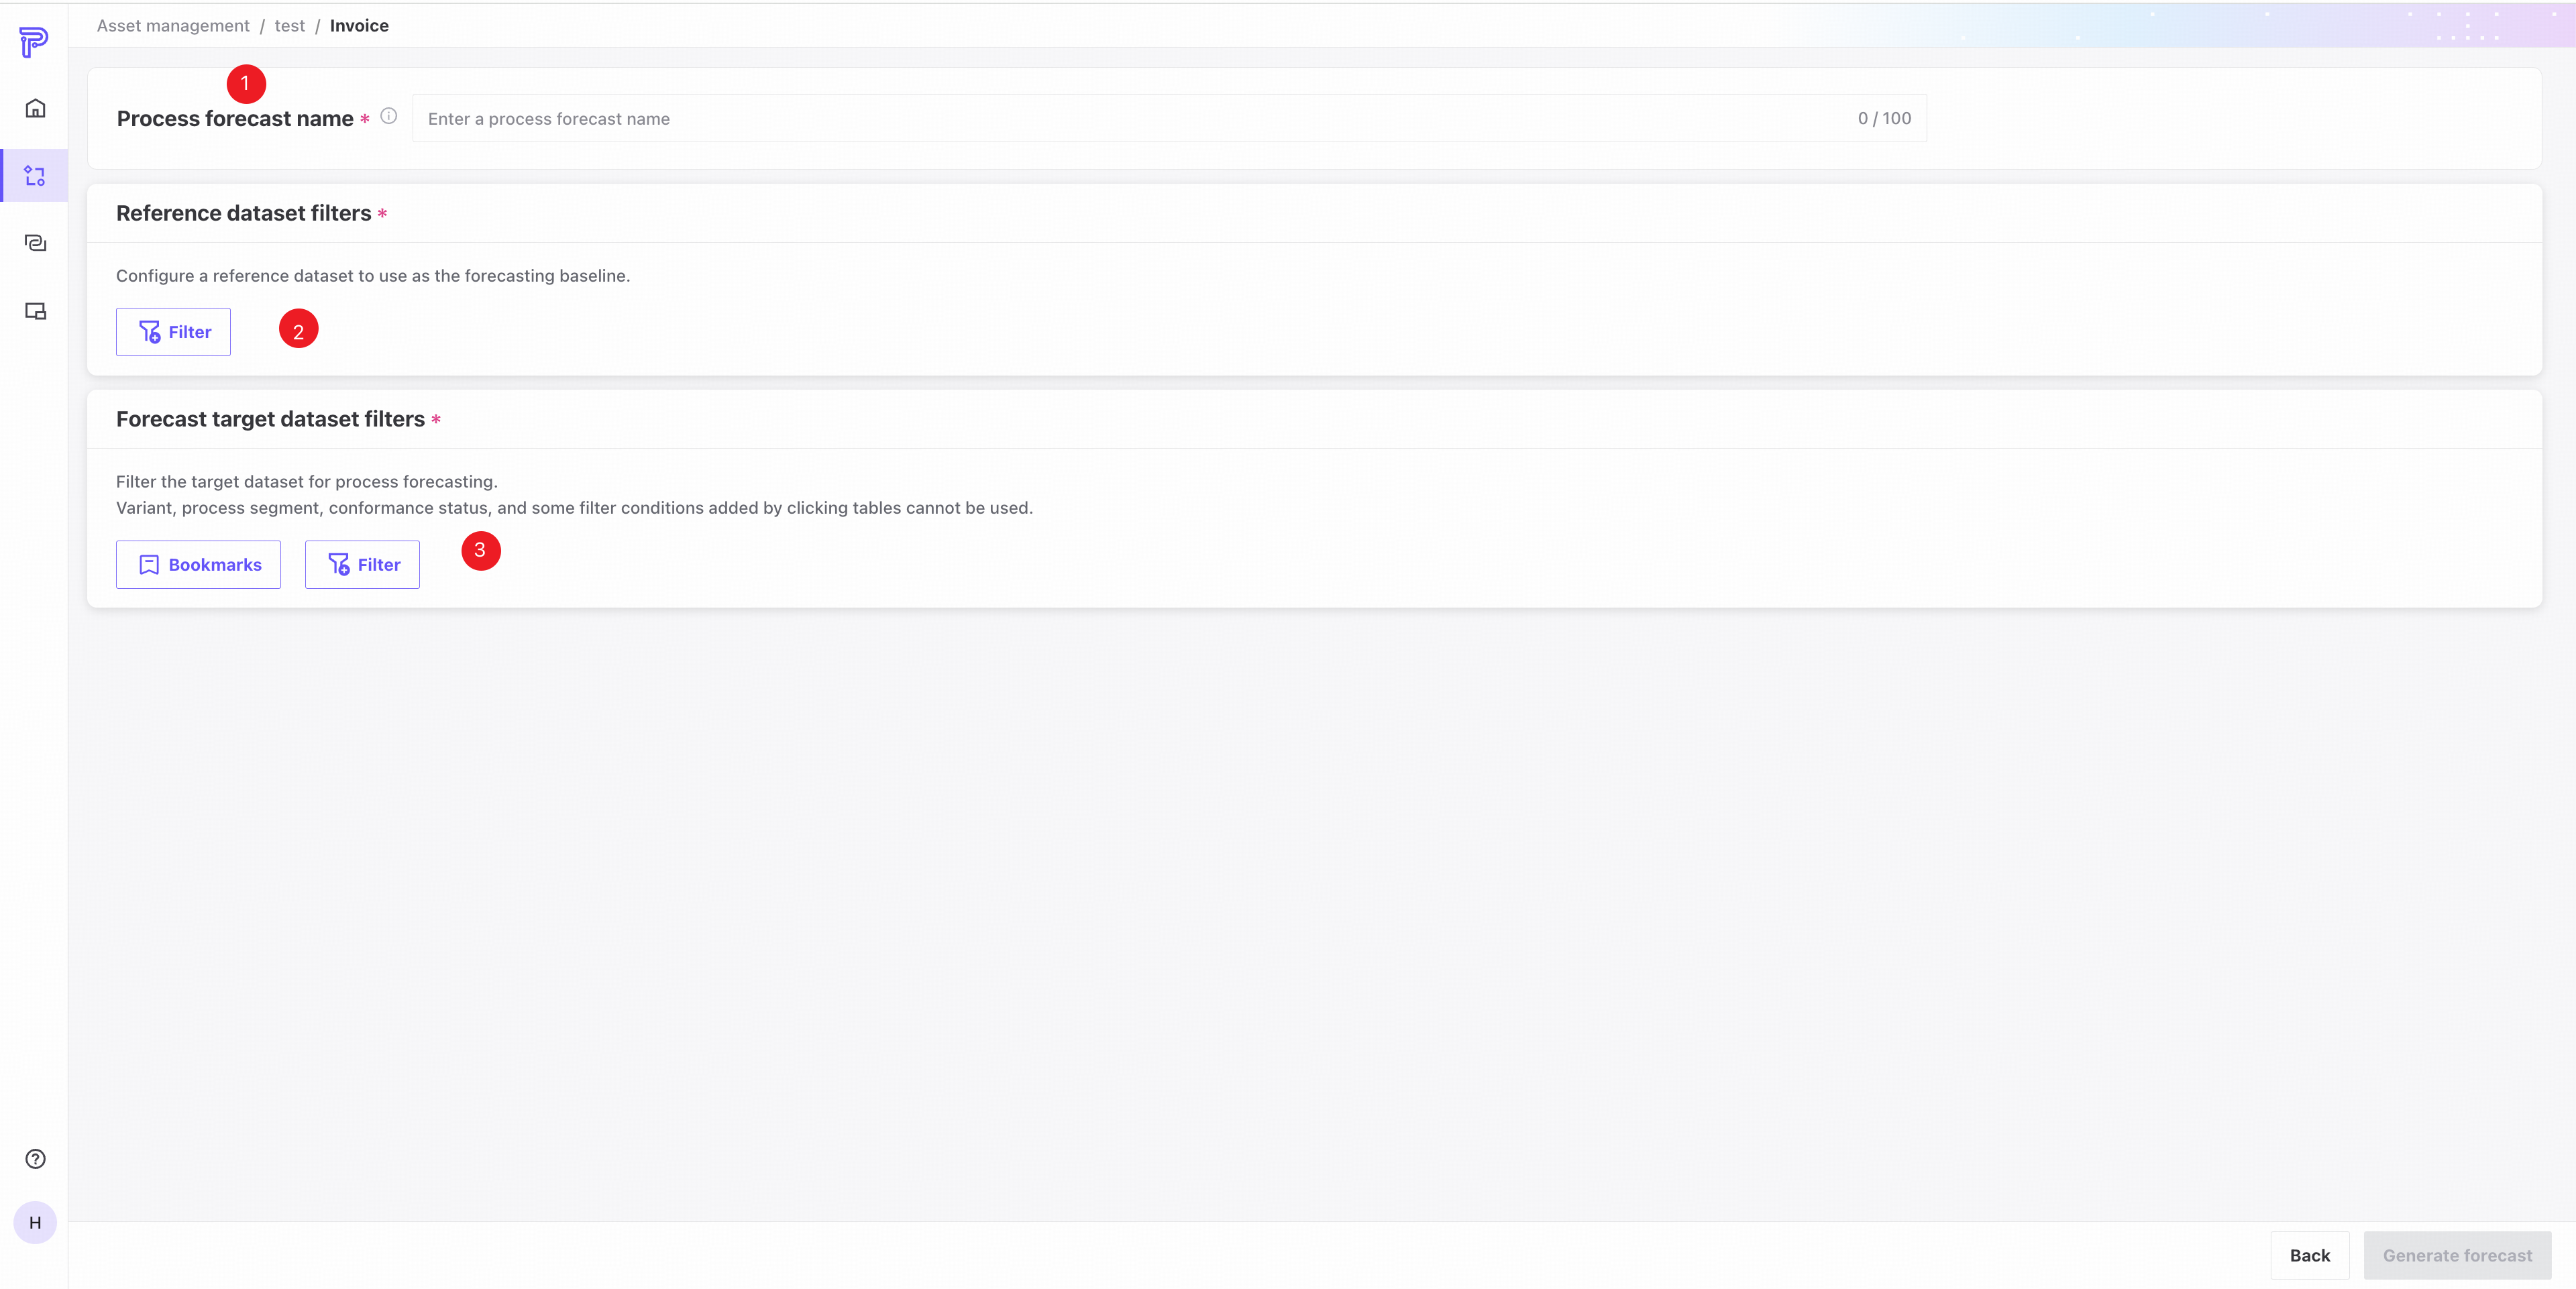
❶ Enter the process forecast name.
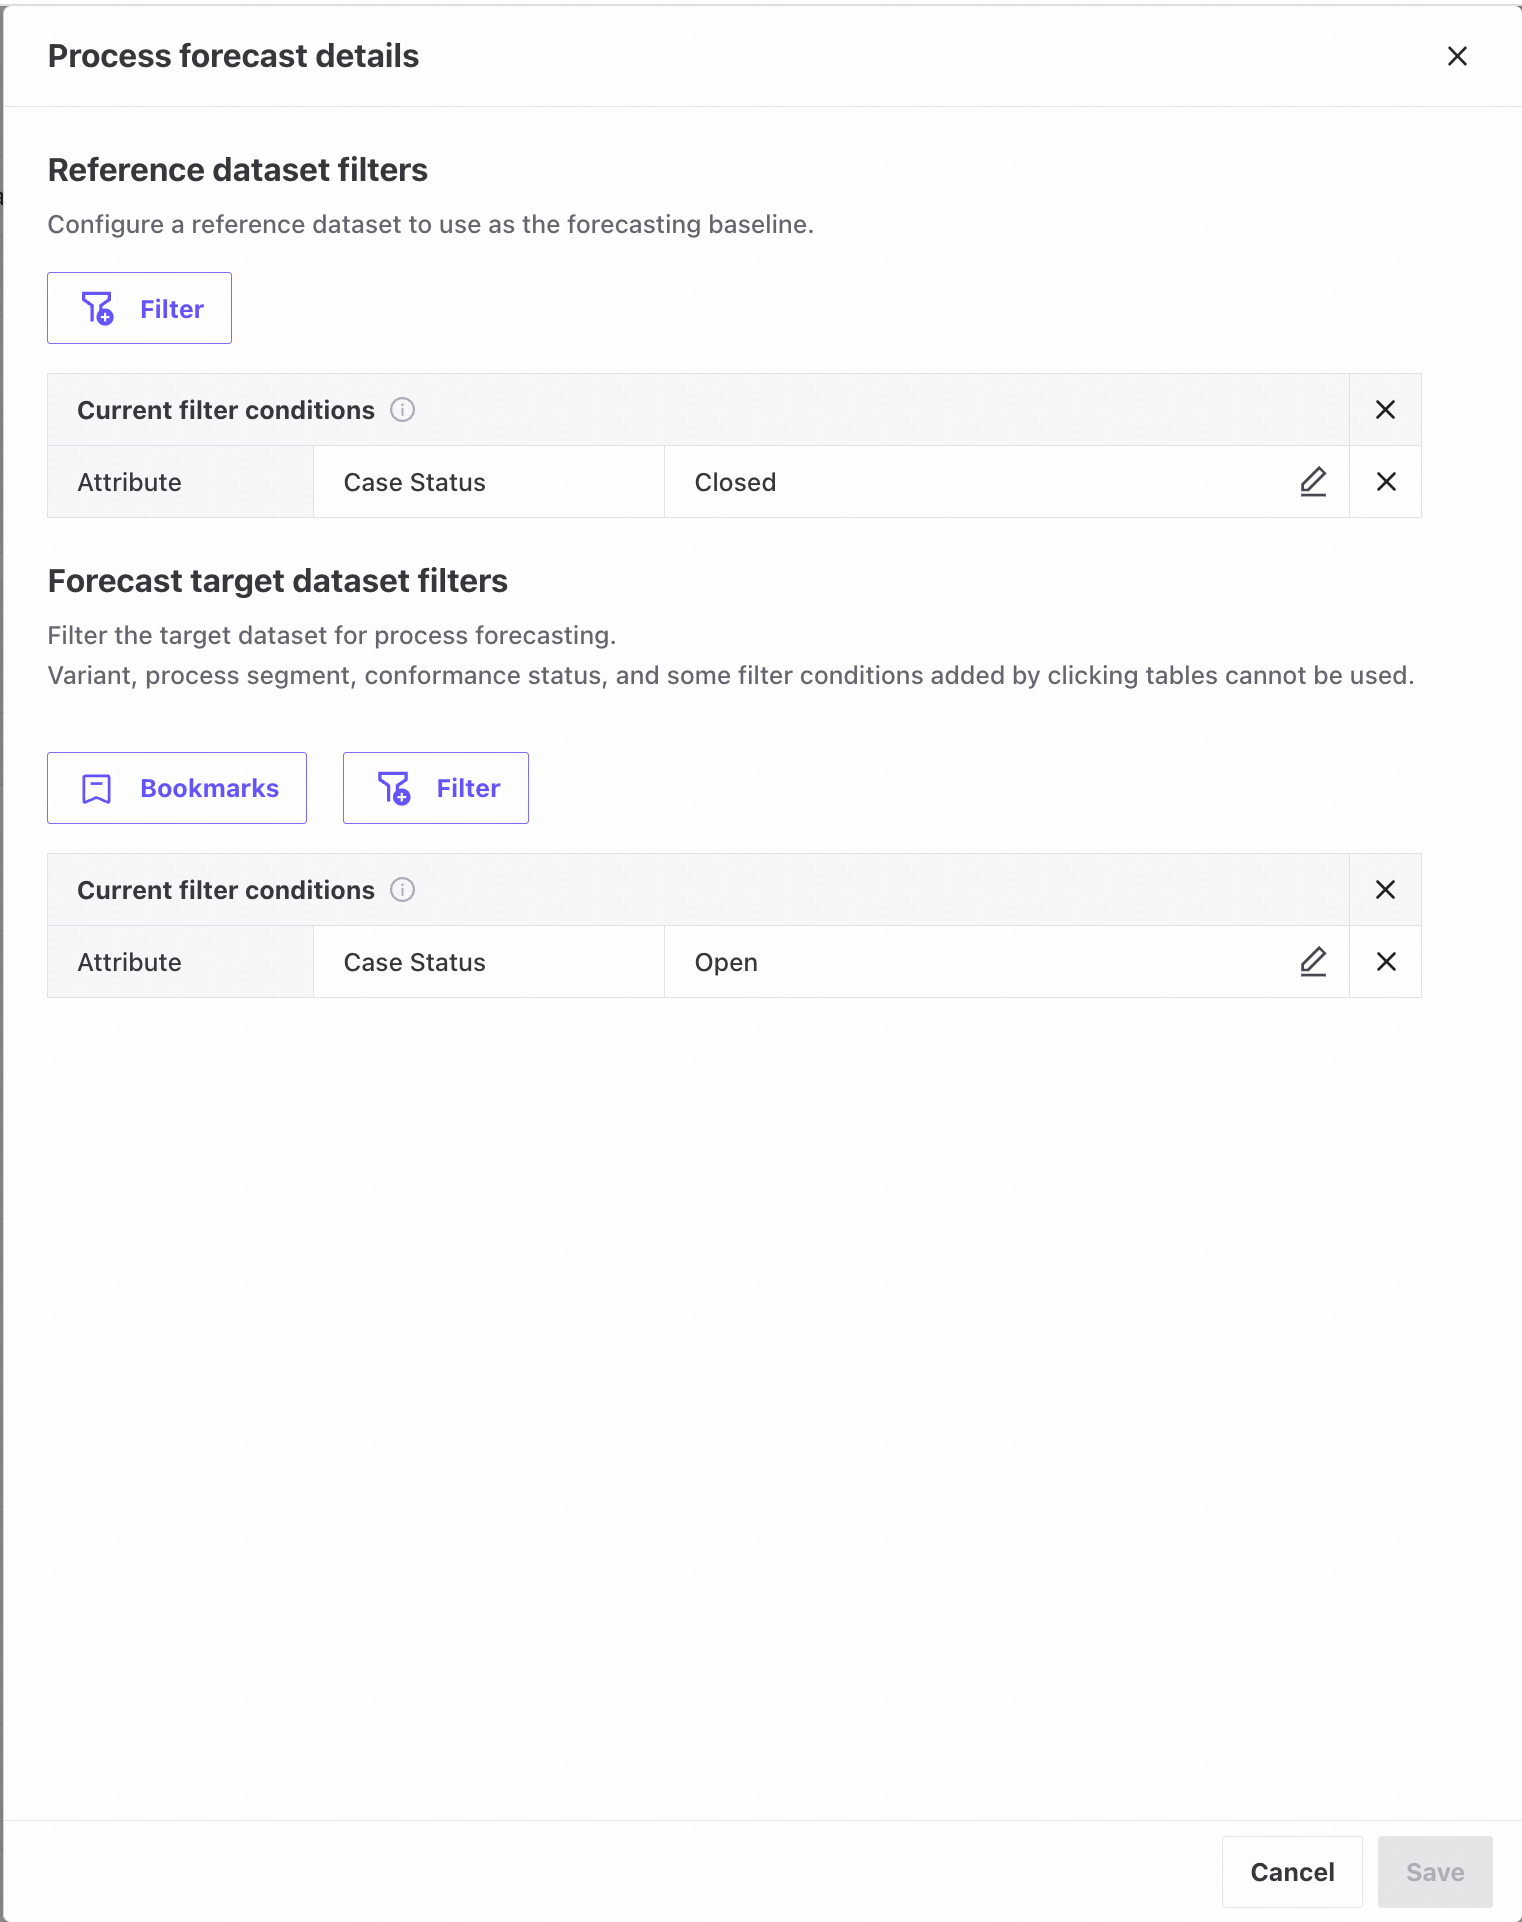
❷ Filter the reference dataset used to generate the forecast. Completed cases are usually selected. For instructions, see Filters.
❸ Filter the target dataset to forecast. Select an existing bookmark or define filter conditions. For instructions, see Filters.
Bookmarks can be selected here, but cannot be edited or created.
Process forecasting overview
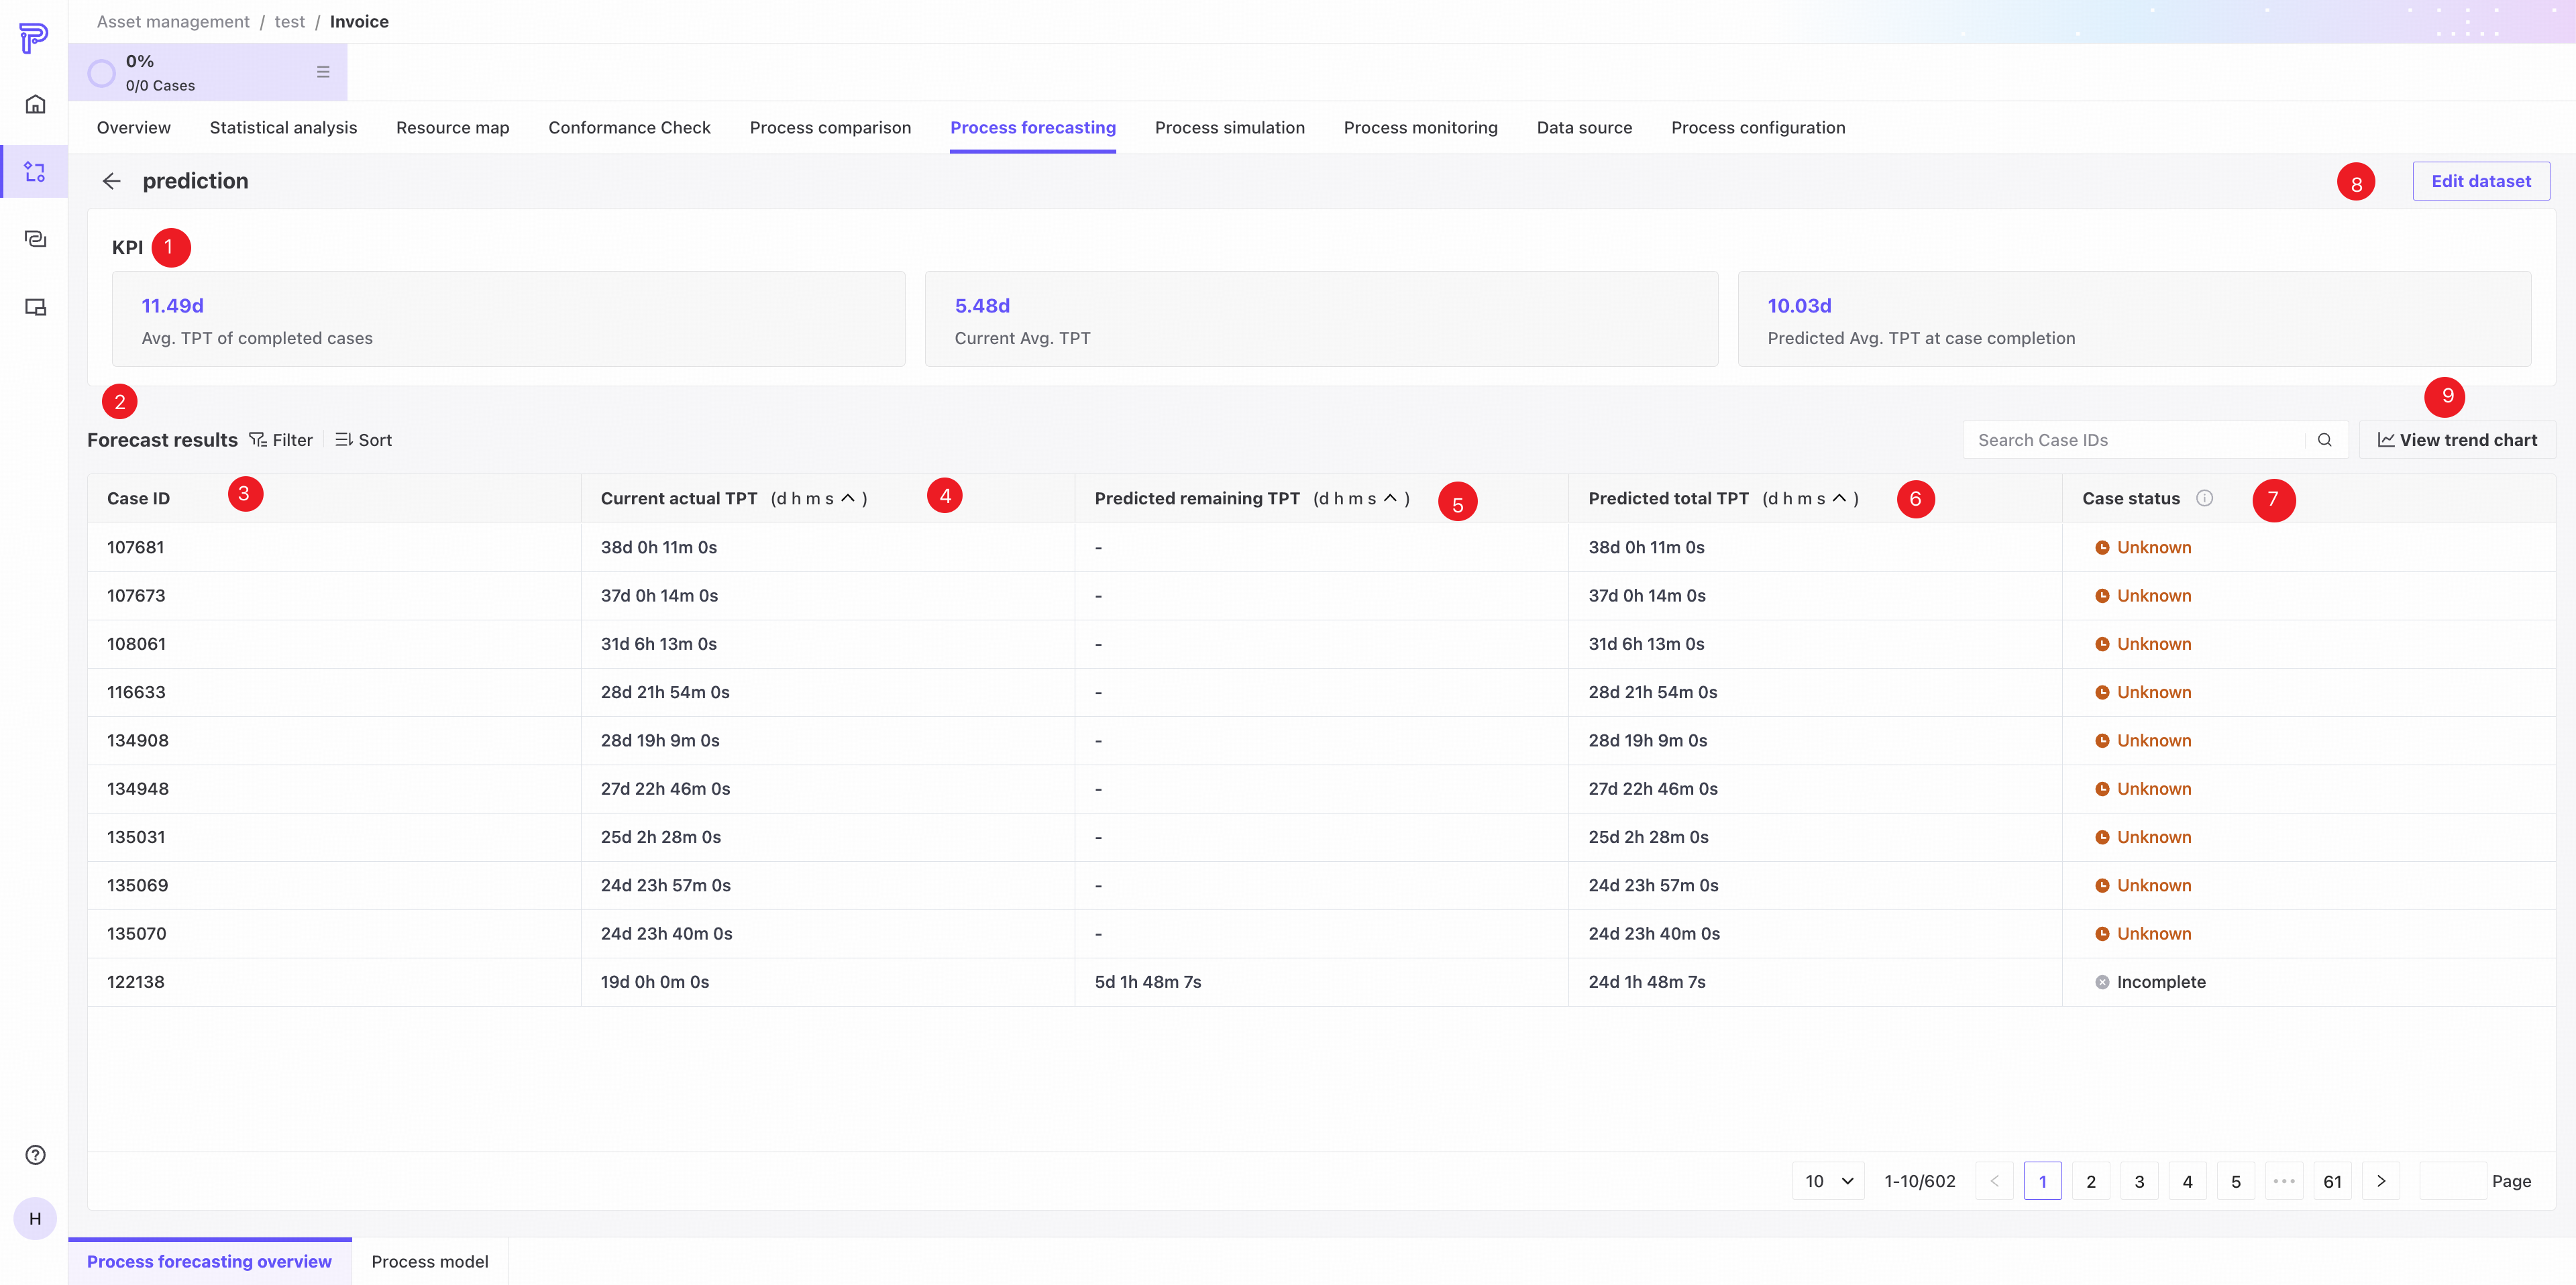
❶ KPI area: average throughput time for completed reference cases, current average throughput time for target cases, and predicted average throughput time.
❷ Forecast results.
❸ Case ID.
❹ The case's throughput time at the current point in time.
❺ Predicted remaining throughput time until completion.
❻ Predicted total case throughput time.
❼ Case status: Unknown means the case does not conform to the current process model.
❽ Open the dataset editor from the right to edit the reference and target datasets.
❾ View trend chart: shows changes in case activities over time to help forecast future case trends.
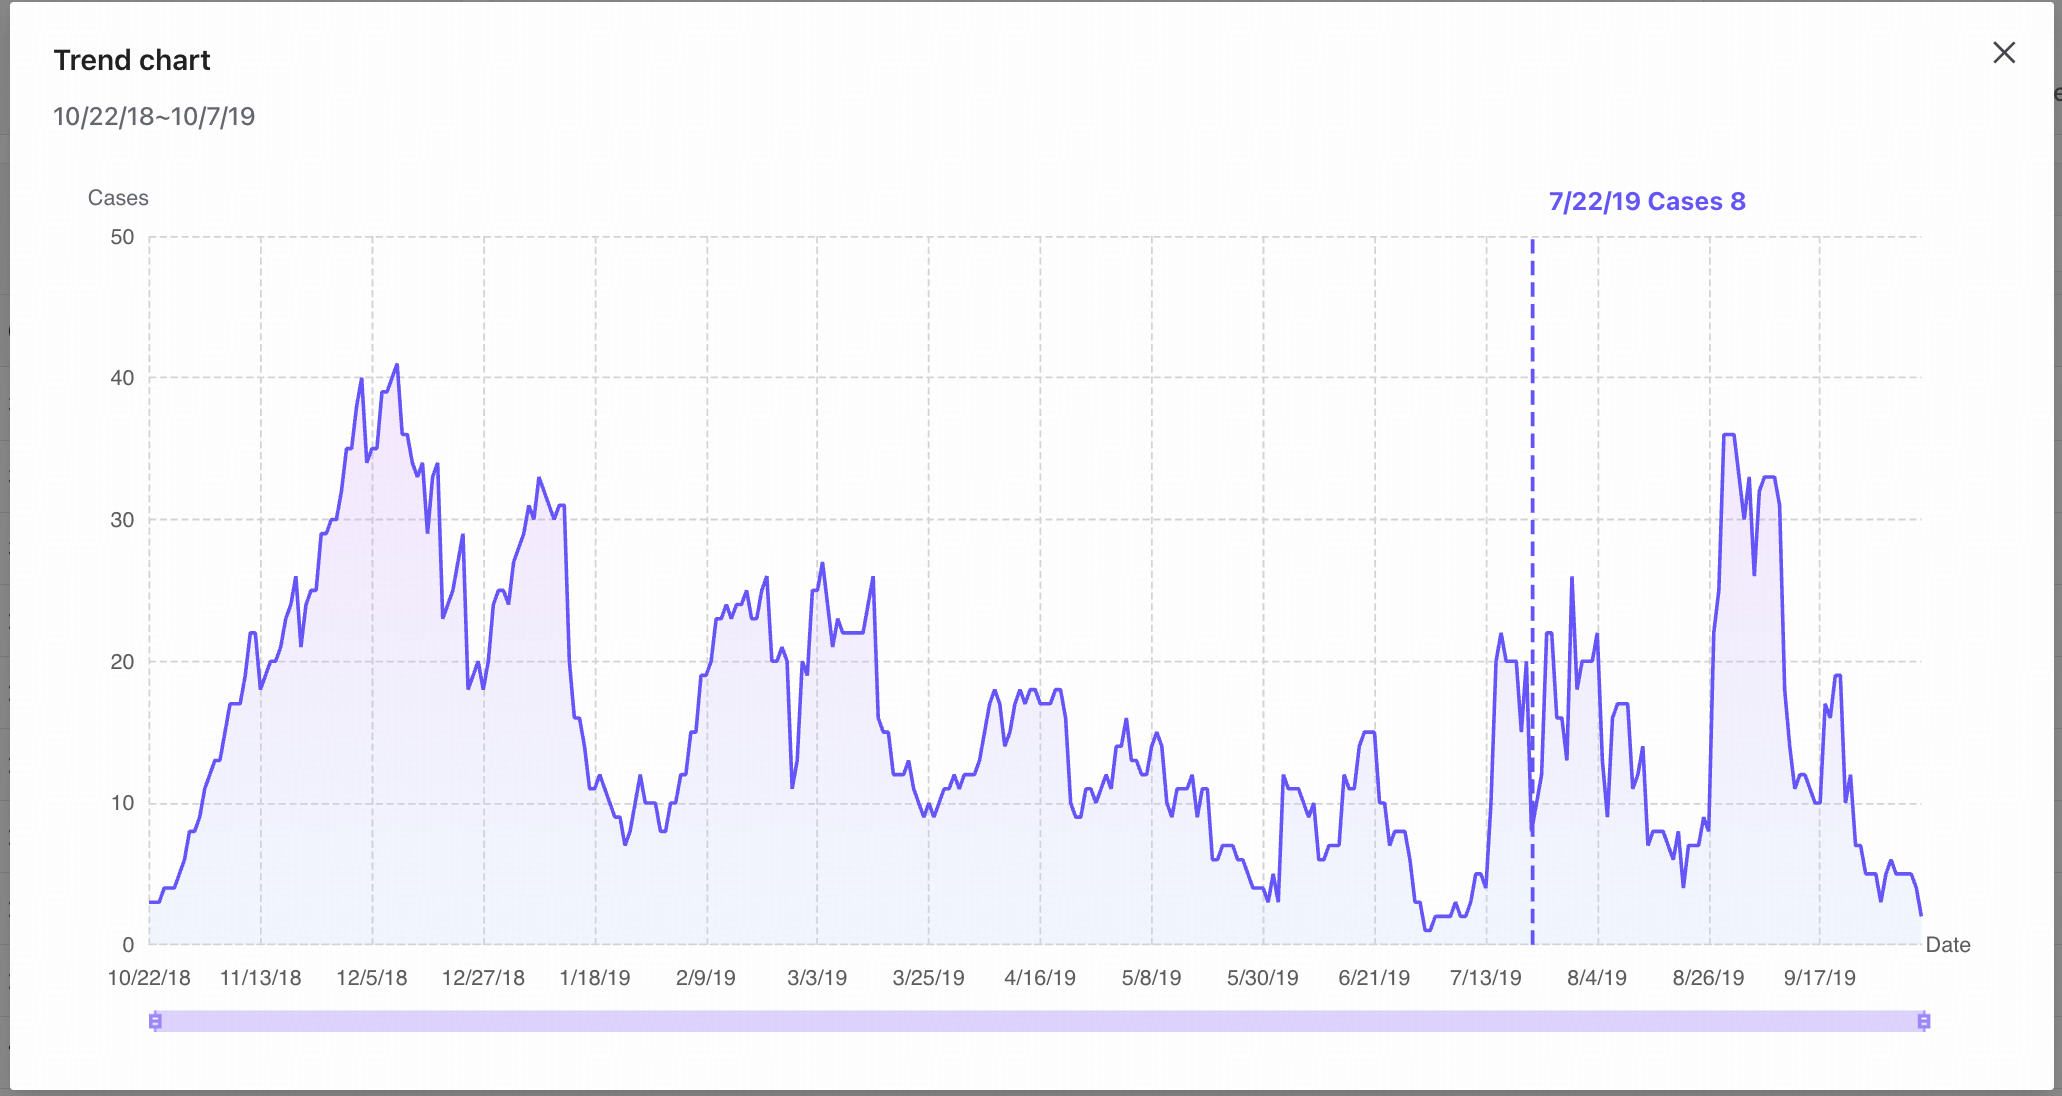
Drag the trend chart timeline to view case occurrences within a specific date range.
Process model
If the active model was discovered with the process mining tool, Variant Explorer displays the loaded model.
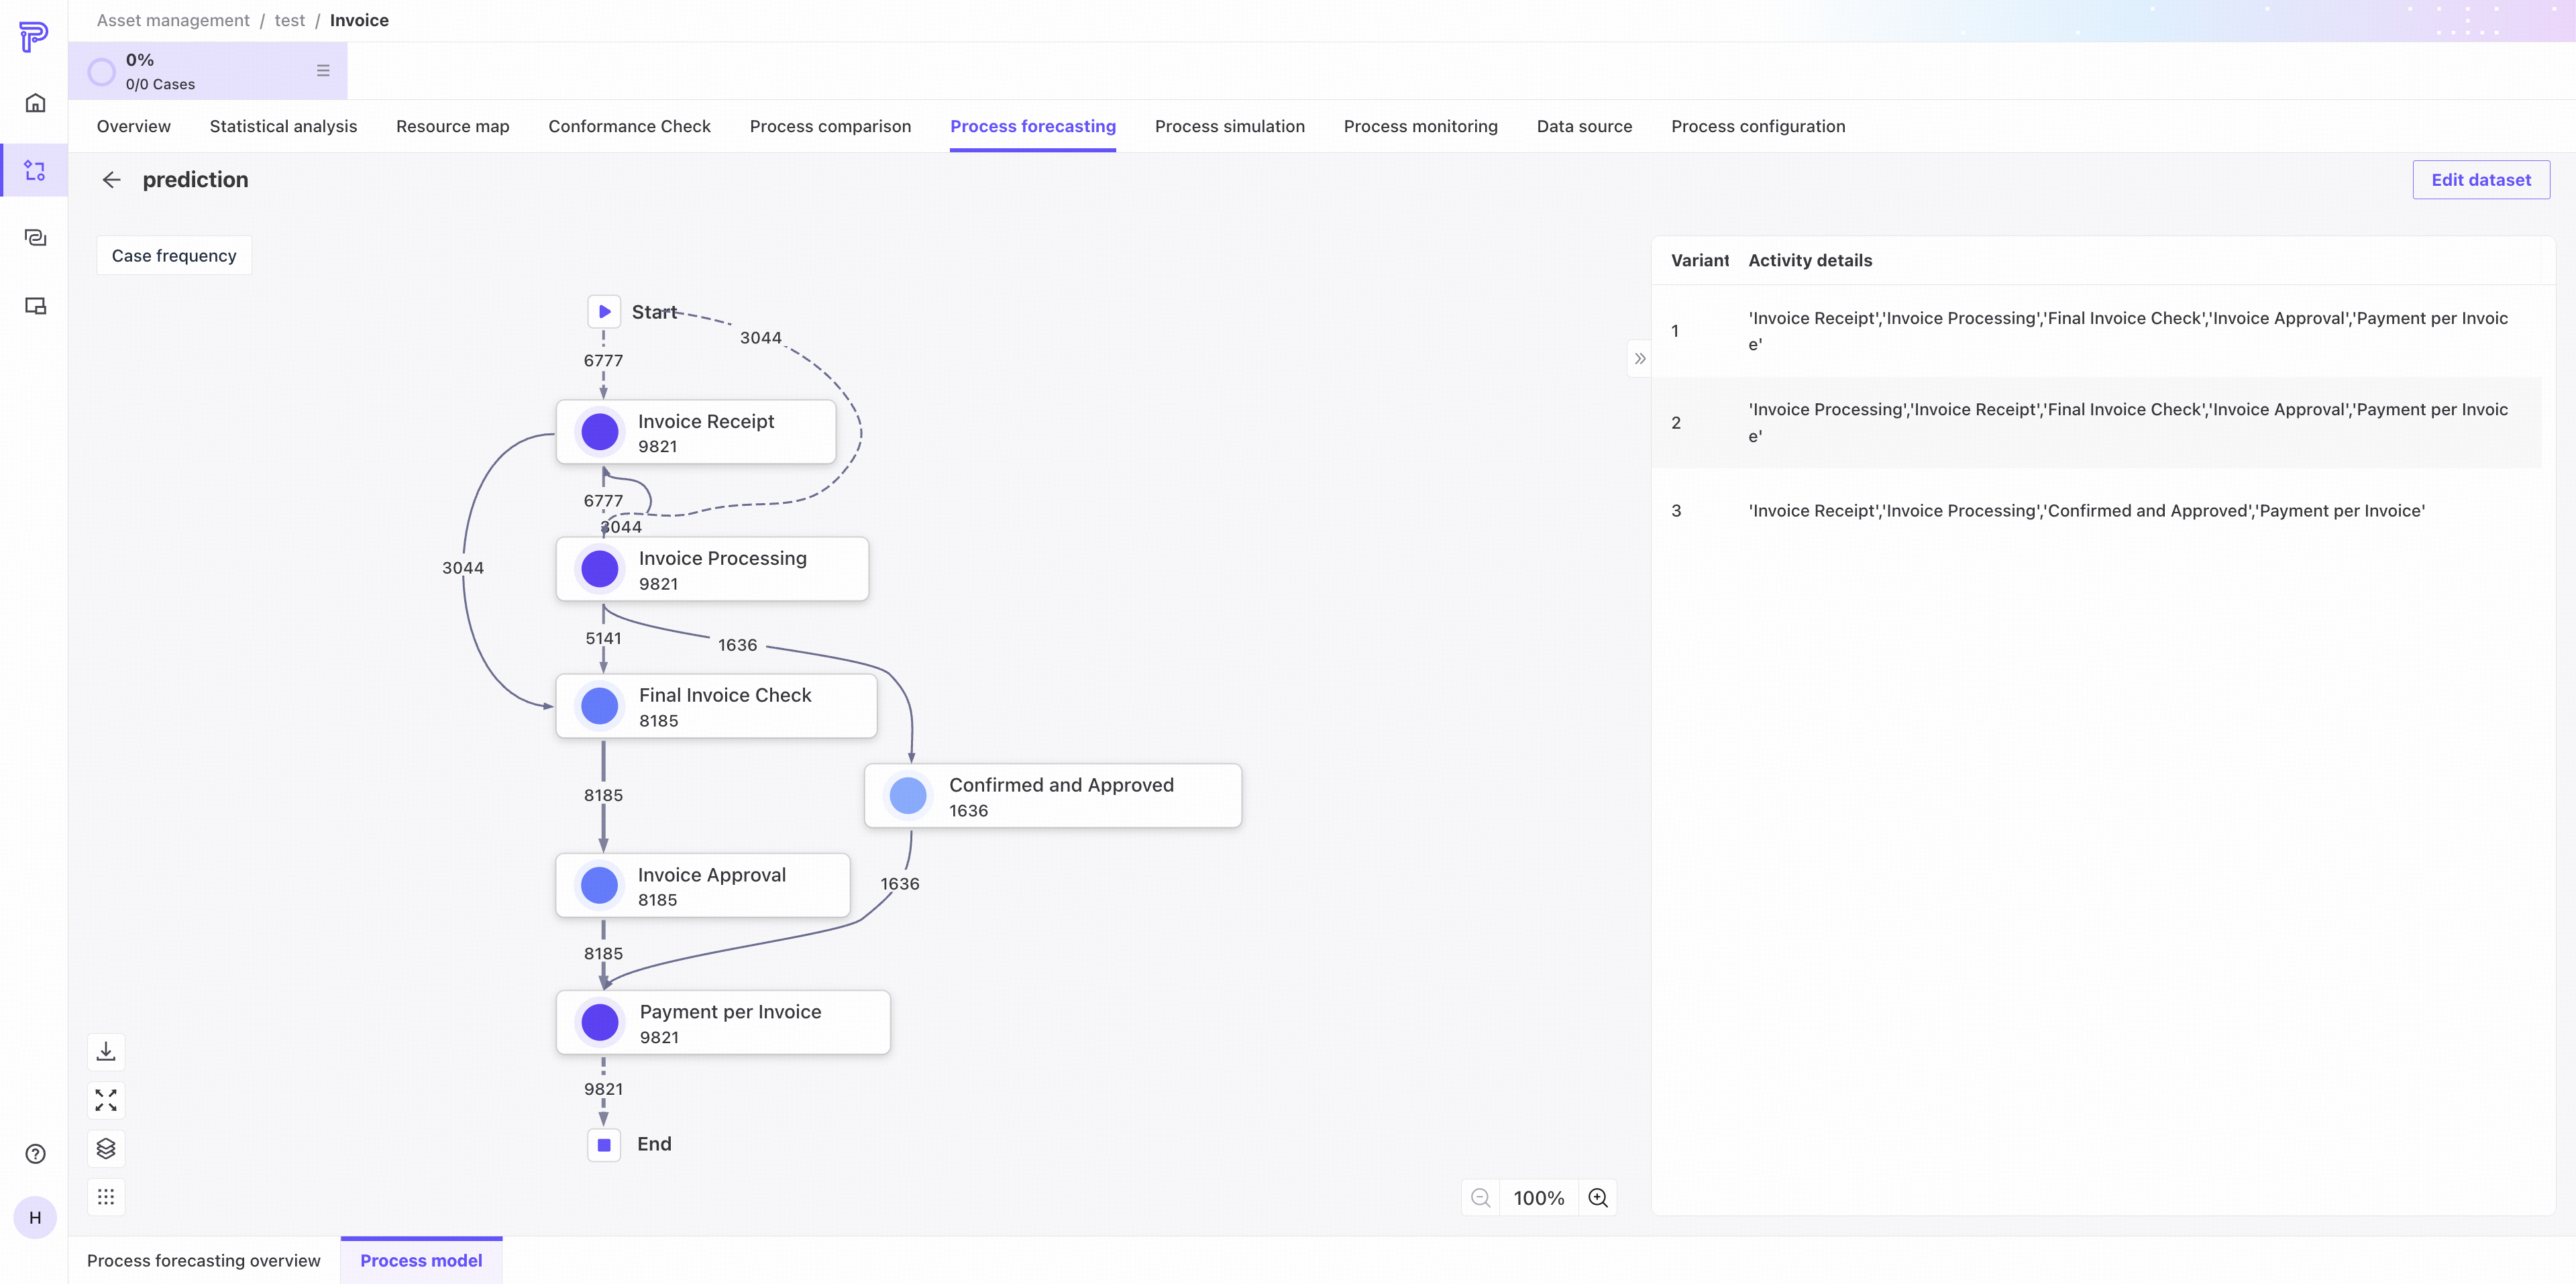
The process map cannot be displayed when the current model's node and edge counts exceed the display limit.
If a BPMN model is loaded, it is displayed as a BPMN diagram.
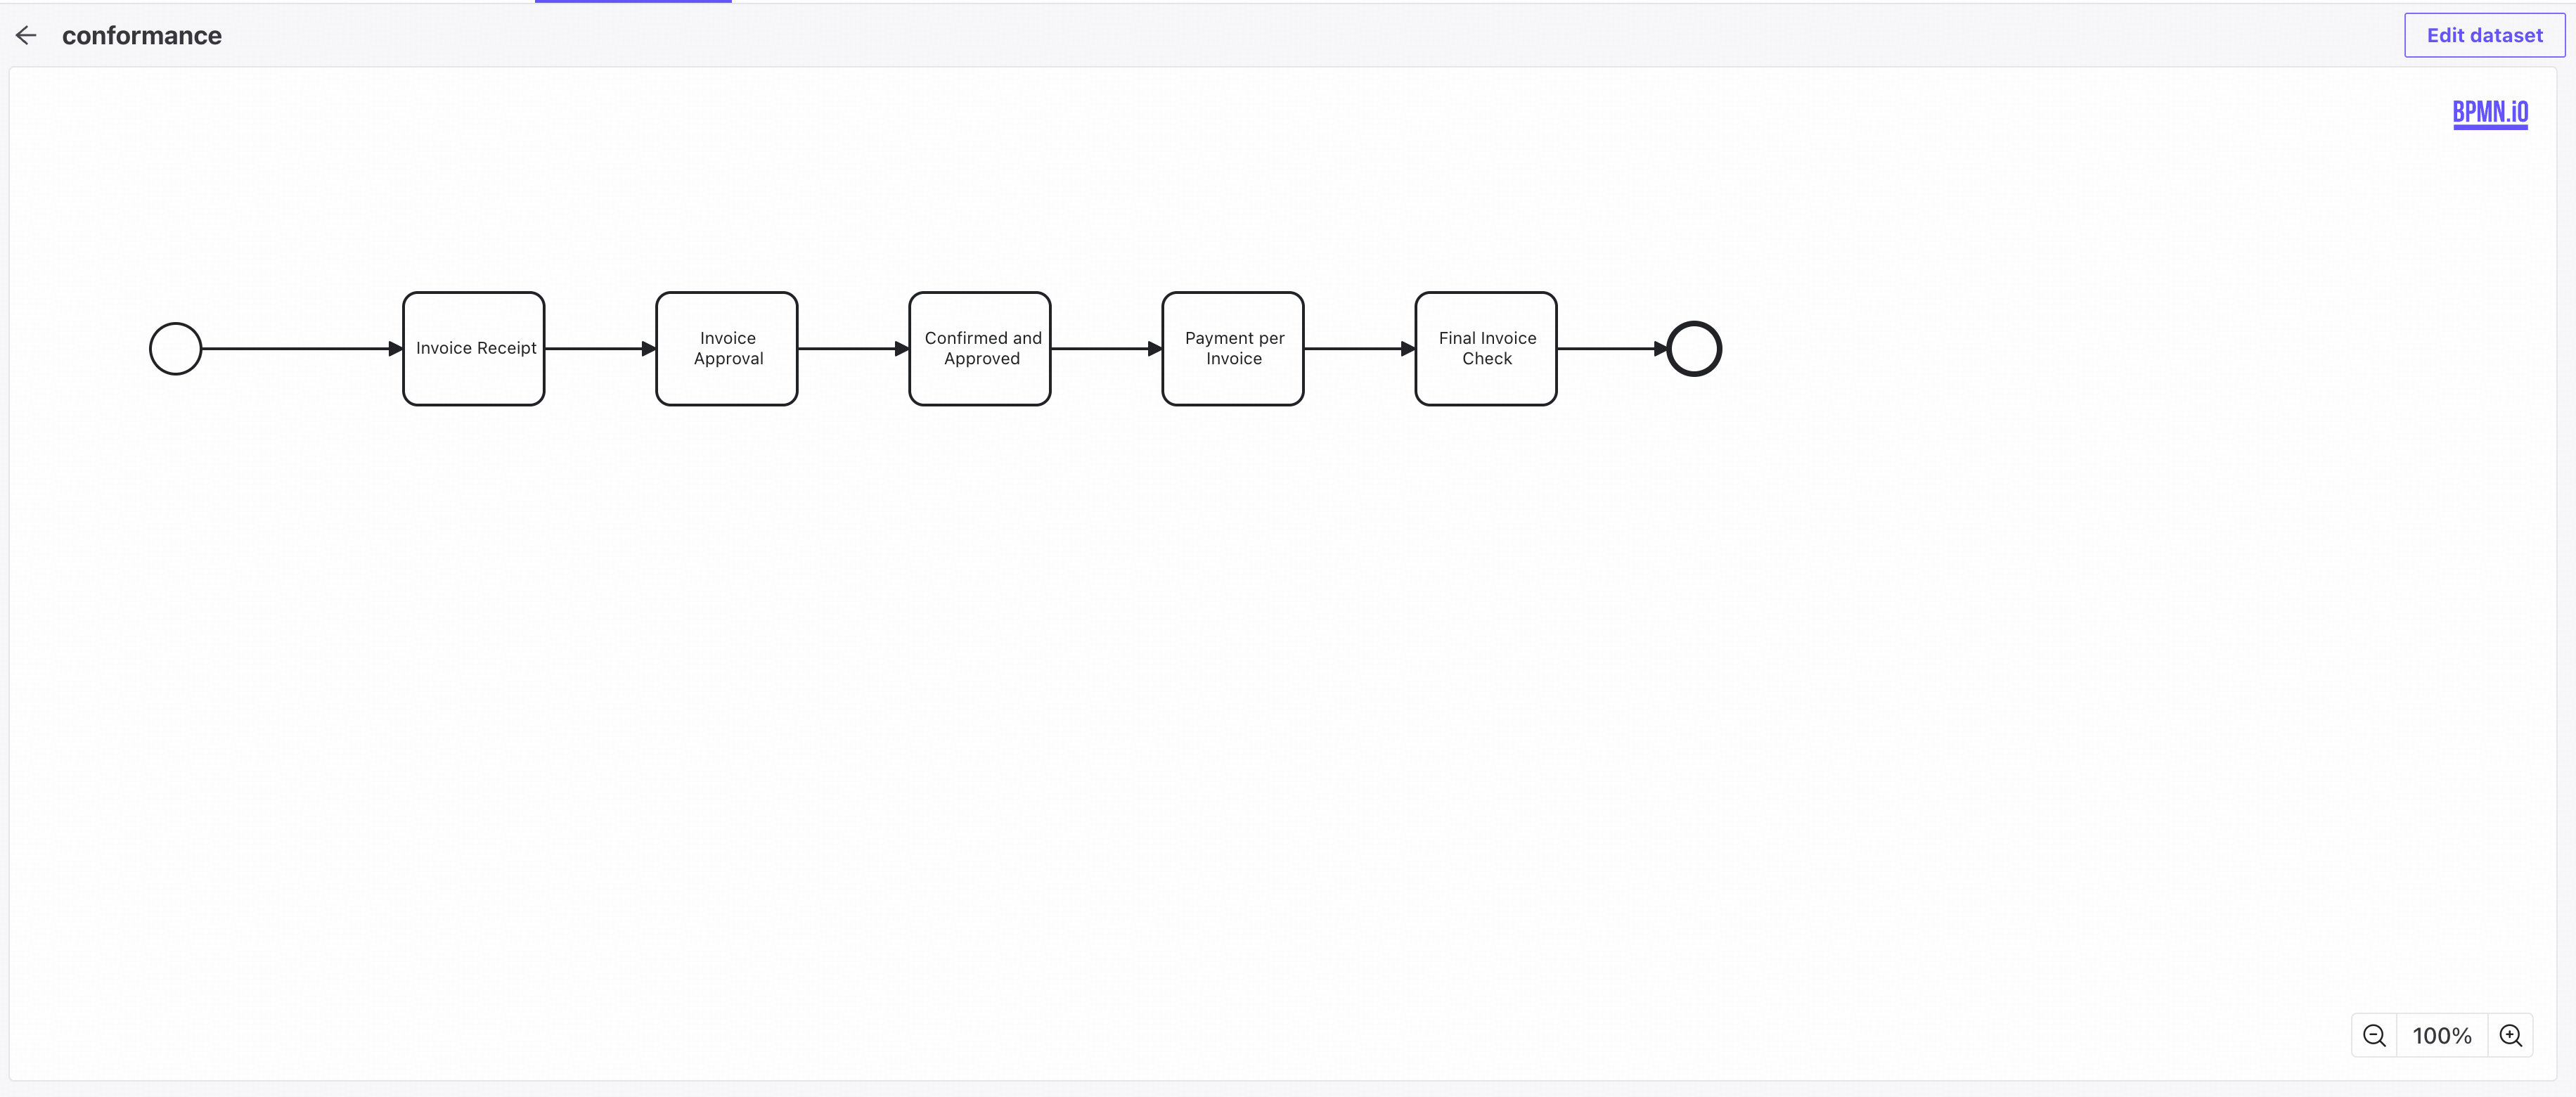
BPMN is a global standard for process modeling. Process models use BPMN 2.0 notation, consisting of activities, connections, gateways, and start/end nodes. Other elements, such as annotations, are ignored. For more information, visit the BPMN website.
Common controls
Filters
❶ Combine filter condition groups using Match all.
❷ Filter lists using their available columns.
Sorting and pagination
❶ Sort lists by available columns in ascending or descending order.
❷ Drag the handle up or down to reorder sorting conditions.
❸ Set the number of entries displayed per page.