Key performance indicators
Overview
Displays the key process KPIs: cases, activities, average throughput time, average rework rate, variants, and average activities per case.
Features
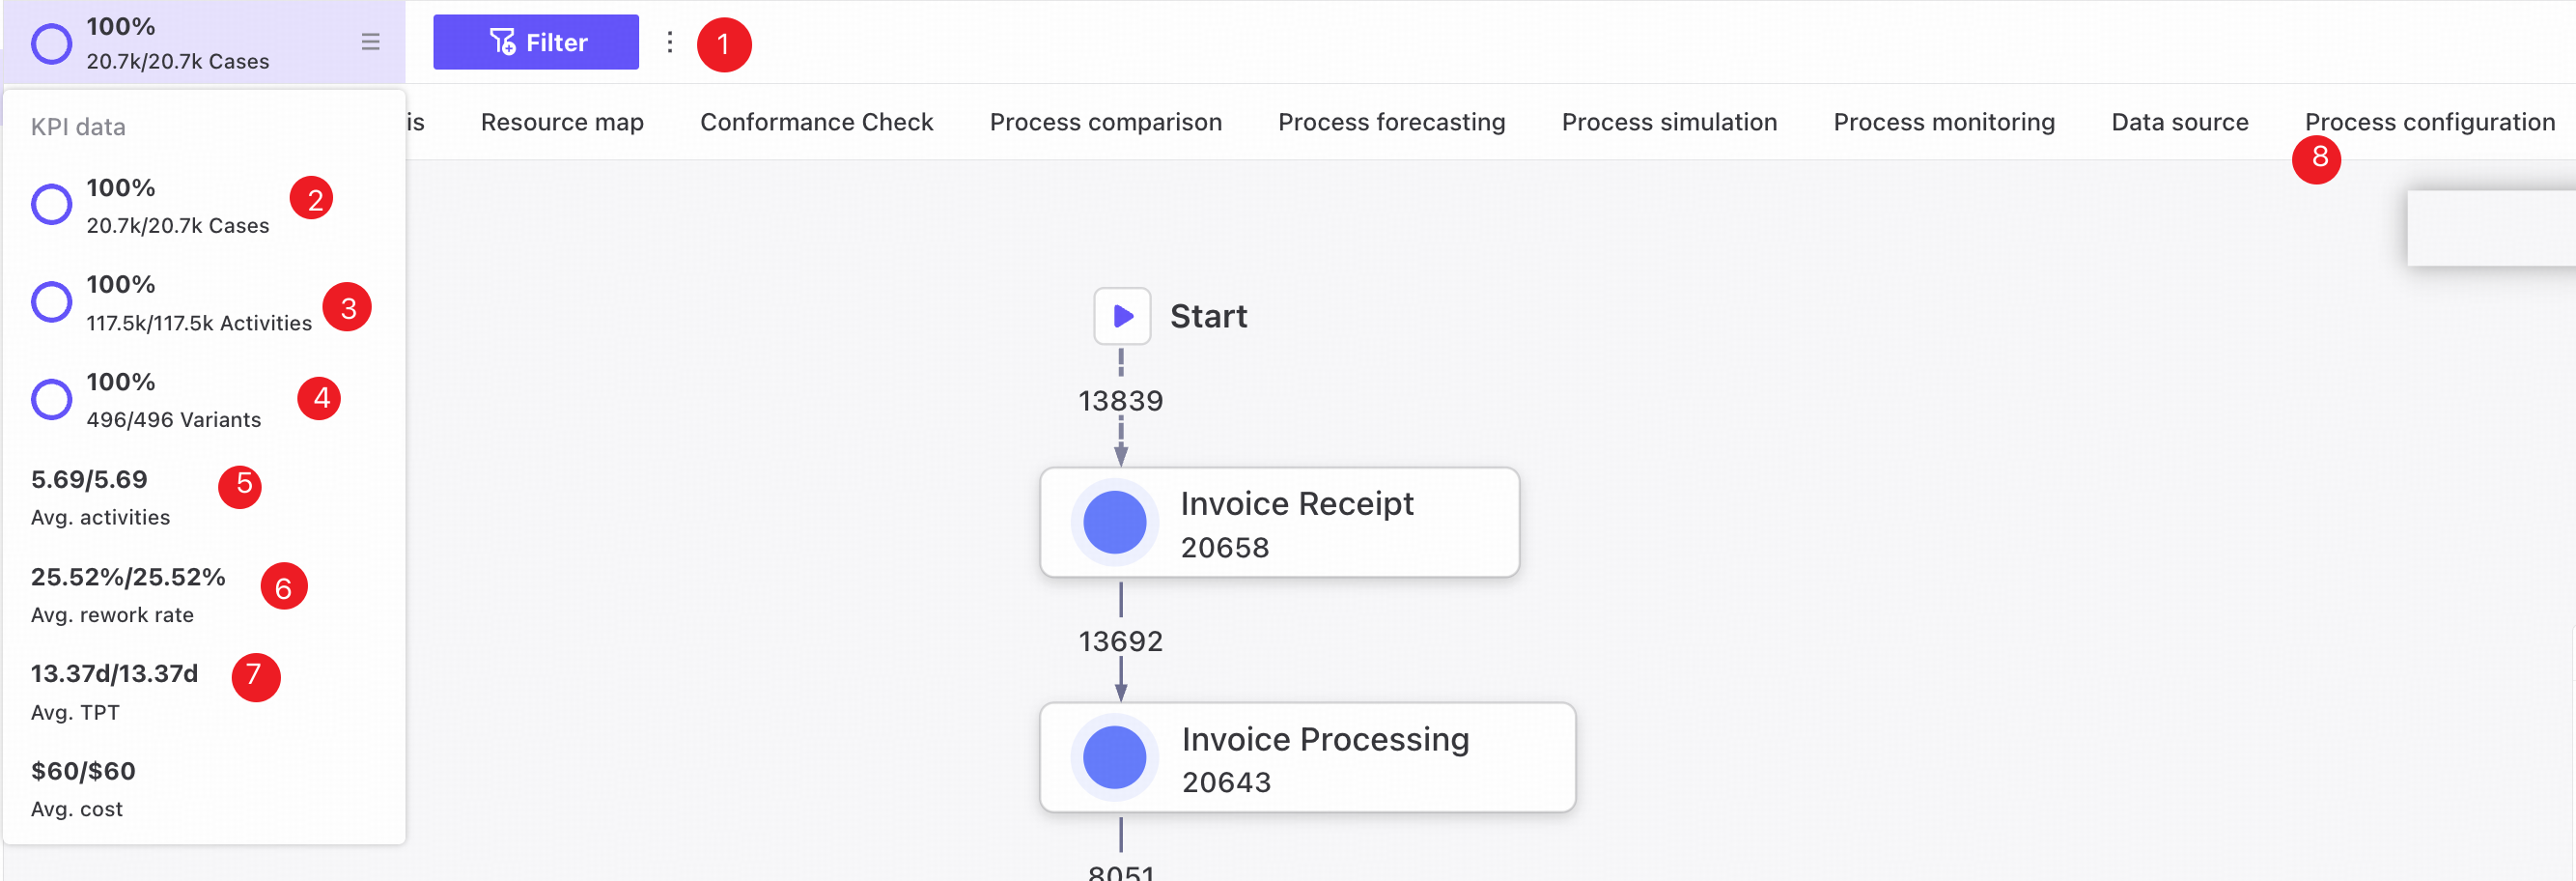
The process Overview page shows general statistics for the process analysis.
❶ Filter conditions: select filters and adjust their ranges to change the analysis overview. For details, see Filter conditions.
❷ Cases: shows the filtered case count, total case count, and the percentage of all cases that match the current filters.
❸ Activities: shows the filtered activity count, total activity count, and the percentage of all activities that match the current filters.
❹ Variants: shows the filtered variant count, total variant count, and the percentage of all variants that match the current filters.
❺ Average activities: shows the average activity count under the current filters and across all data.
❻ Average rework rate: shows the average rework rate under the current filters and across all data.
❼ Average throughput time: shows average throughput time under the current filters and across all data.
Secondary menu
❽ Pages available from the secondary menu:
- Resource map
- Conformance Check
- Statistical analysis
- Process comparison
- Process forecasting
- Process simulation
- Process monitoring
- Data source
- Process configuration