Monitor settings
Overview
Process monitoring helps organizations improve operating efficiency, maintain business continuity, and control quality. Track process steps in real time, detect anomalies or inefficiencies promptly, and take action to improve overall performance.
Features
Define KPIs for your business needs. When a KPI in newly added data reaches or exceeds its threshold, the system automatically sends alert notifications to the relevant people.
Create a monitor
Click Create monitor, enter a name, and describe its purpose, scope, and importance. Select the key measure to monitor from the custom KPI list.
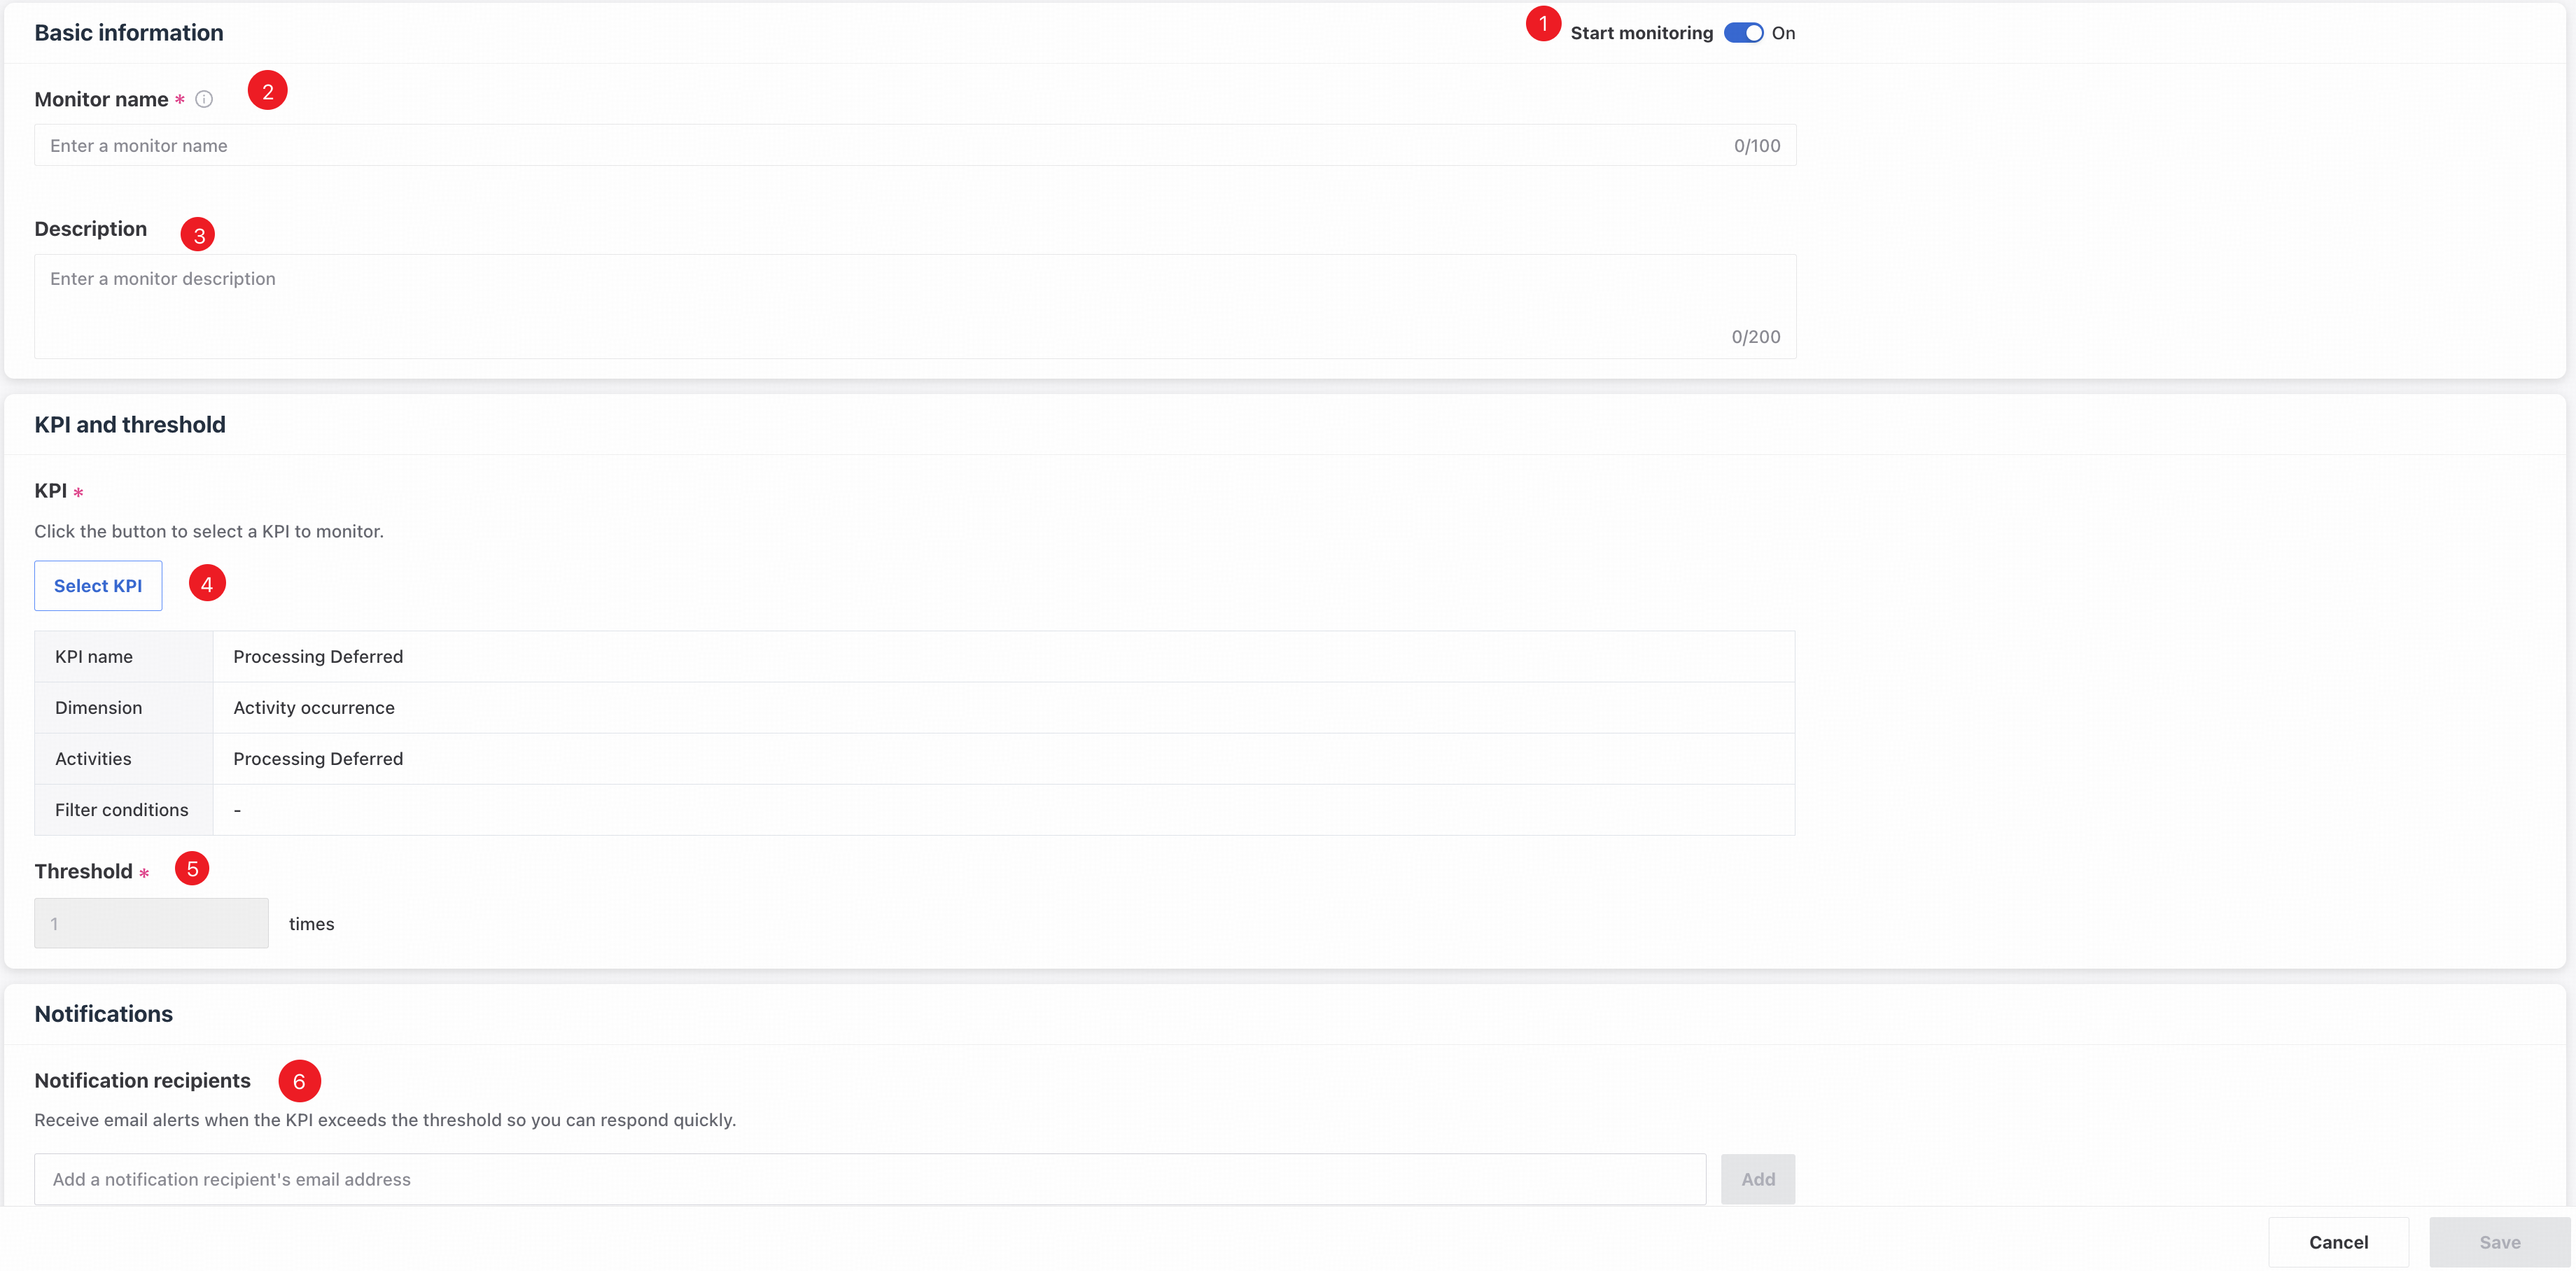
❶ Monitor name: enter a name.
❷ Monitor description: add a description.
❸ Start monitoring: enabled by default when a monitor is created; click to turn it off.
❹ Select KPI: choose a KPI to monitor.
- Case duration: monitors elapsed time for all incomplete cases, helping identify delays and improve case handling efficiency.
- Reworks per case: monitors rework caused by errors, omissions, requirement changes, or other reasons, helping you reduce rework rates.
- Activity duration: monitors elapsed time for incomplete activities, helping you detect delays and respond faster.
- Activity reworks: monitors rework counts for a specific activity in each case so you can take targeted action.
- Activity occurrence: monitors when a specific activity occurs, helping you detect abnormal activities and correct the process promptly.
- Activity traversal: monitors the flow from one specified activity to another to detect and correct abnormal transitions.
❺ Threshold: an alert is triggered when the KPI is greater than or equal to this value.
❻ Notification recipients: select any tenant members to receive alert emails.
View monitors
The Process monitoring page shows the latest scan overview so you can track process status. It includes:
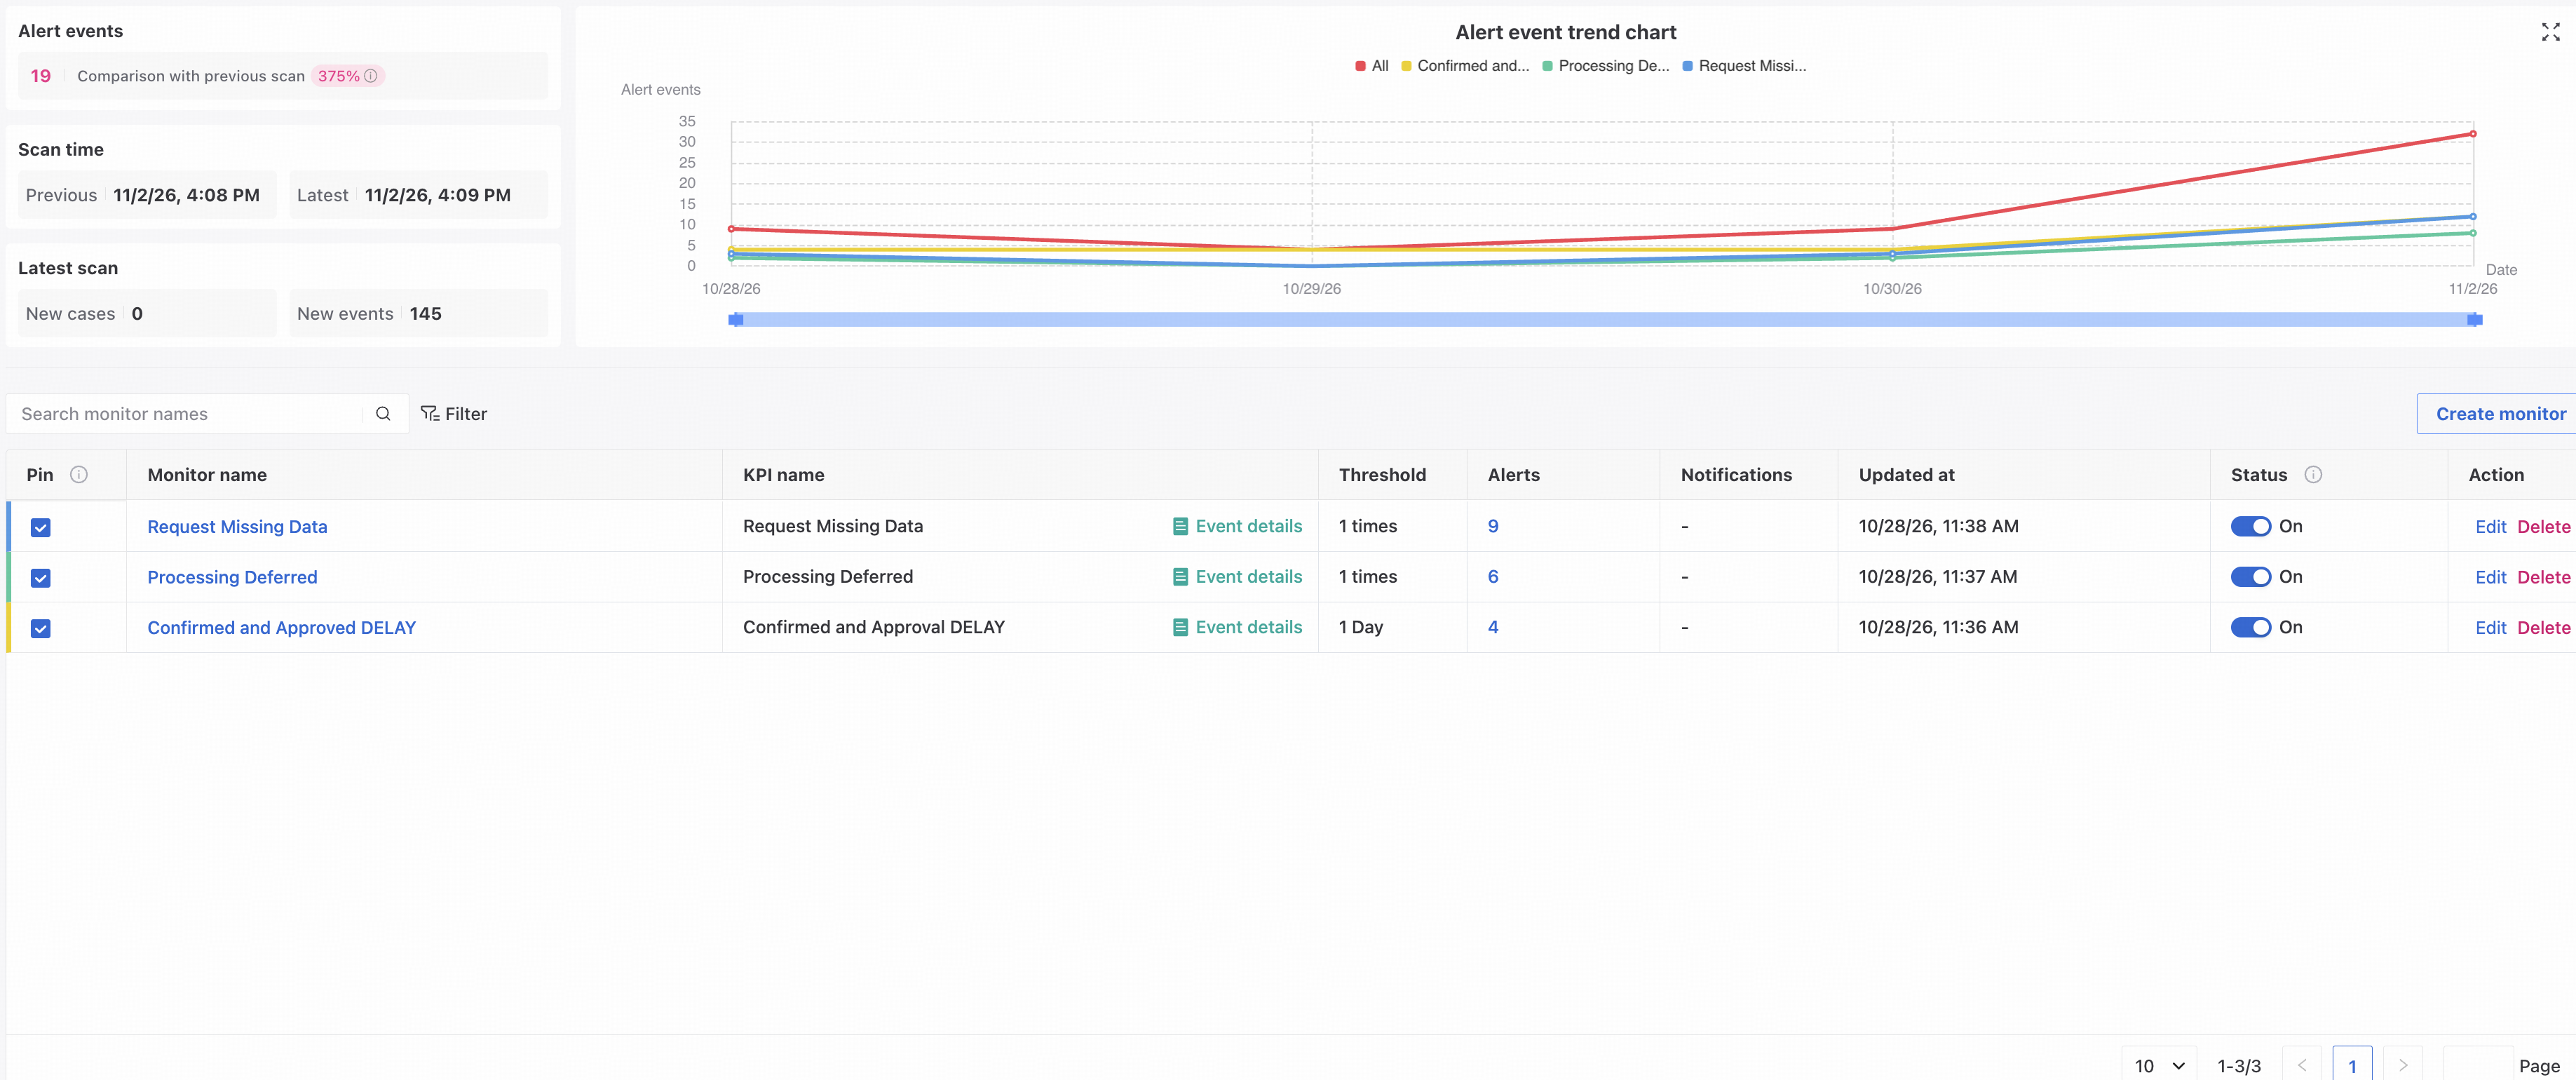
- Total alert events and change: the current total and its change from the previous period, helping identify increasing or decreasing risk.
- Alert event trend chart: alert events over time. Click Pin in the monitor list to add a monitor to the chart.
- New cases and events: counts added in the current scan.
- Monitor list: monitor name, KPI, KPI parameters, threshold, latest alert event count, notification settings, update time, and status (On/Off).
Turn monitoring on or off
You can change monitor status in either of two ways:
Use the status toggle in the monitor list.
Open the details page through View or Edit, then use the Start monitoring toggle.
Once enabled, monitoring scans automatically the next time the data source changes.
Edit a monitor
Click Edit on the Process monitoring page, or open a monitor's details and click Edit.
Editing an active monitor requires turning it off. Confirm the prompt to turn it off and open the editor.
Delete a monitor
Click Delete on the Process monitoring page to delete a monitor. Its historical alerts remain available under Alert events.