Resource map
Overview
Resource map shows how different roles or people participate in the process. Examine workload and activity execution efficiency, identify dependencies between resources, and improve resource allocation.
Resource charts and related features are unavailable until a resource is selected for analysis. Go to the Data source page and configure a Resource column first.
Features
Resource map
The resource chart shows workload, efficiency, detailed data, and relationships by resource.
- Each bubble shows the quantity distribution of a resource in the selected view.
- Bubbles represent different resources. Larger, darker bubbles indicate higher values.
View the top or bottom 20 resources by average daily processing volume or average throughput time. You can also ignore resources.
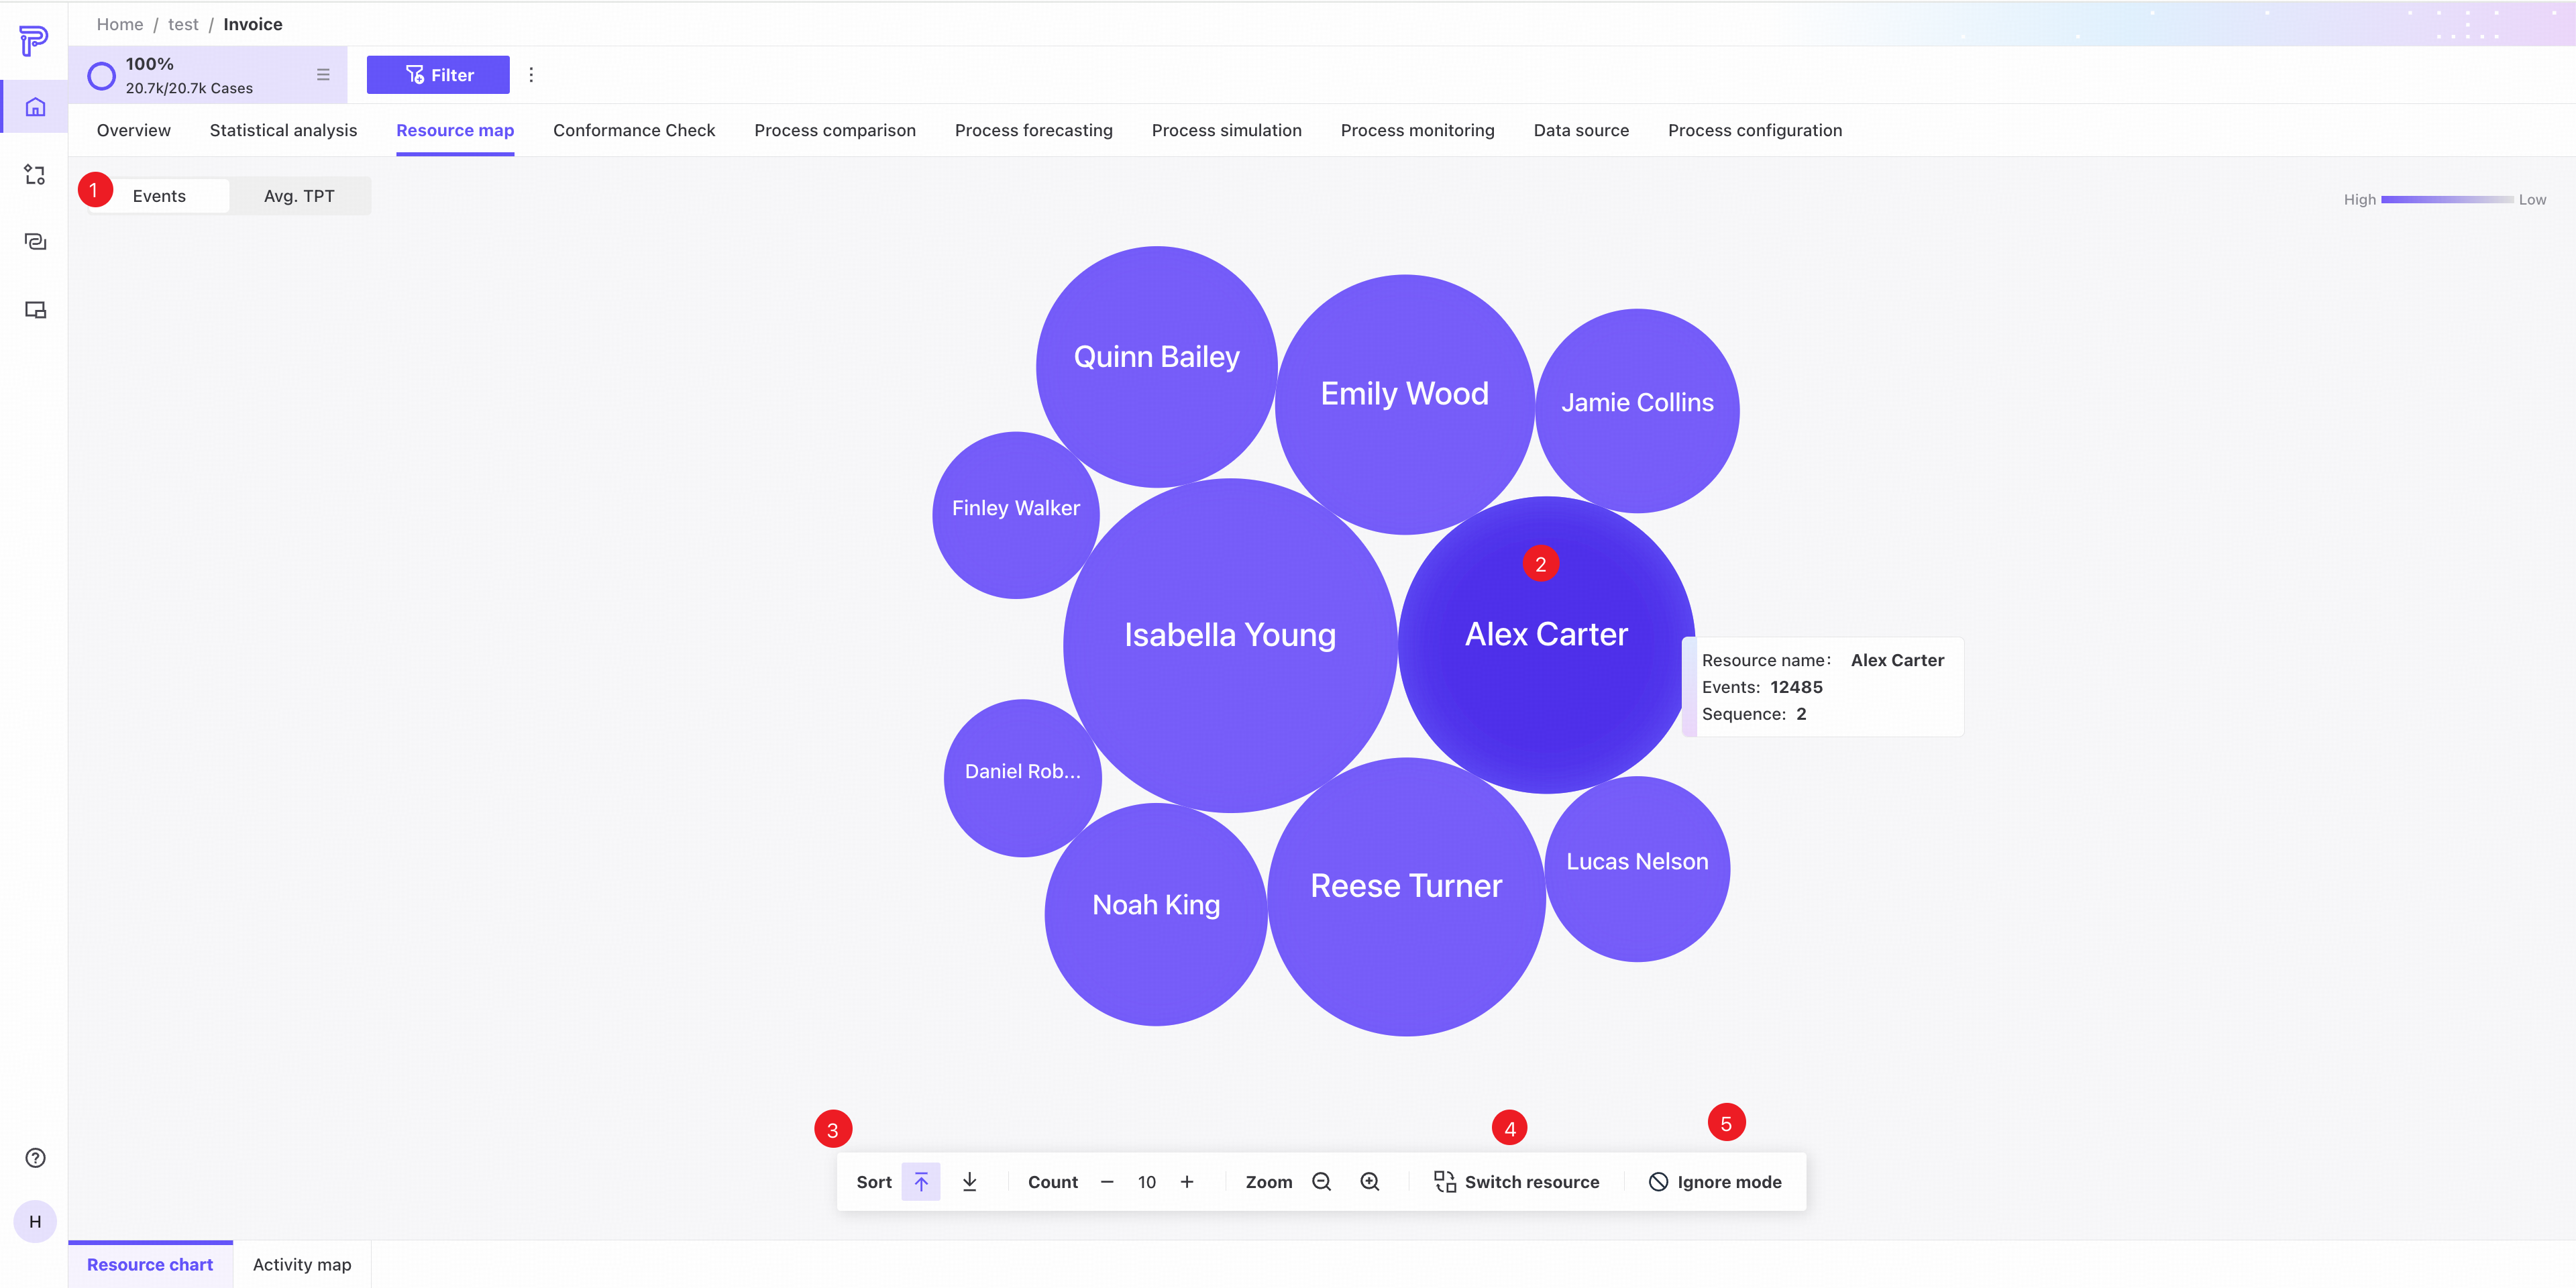
❶ Switch the map between average daily events processed and average throughput time.
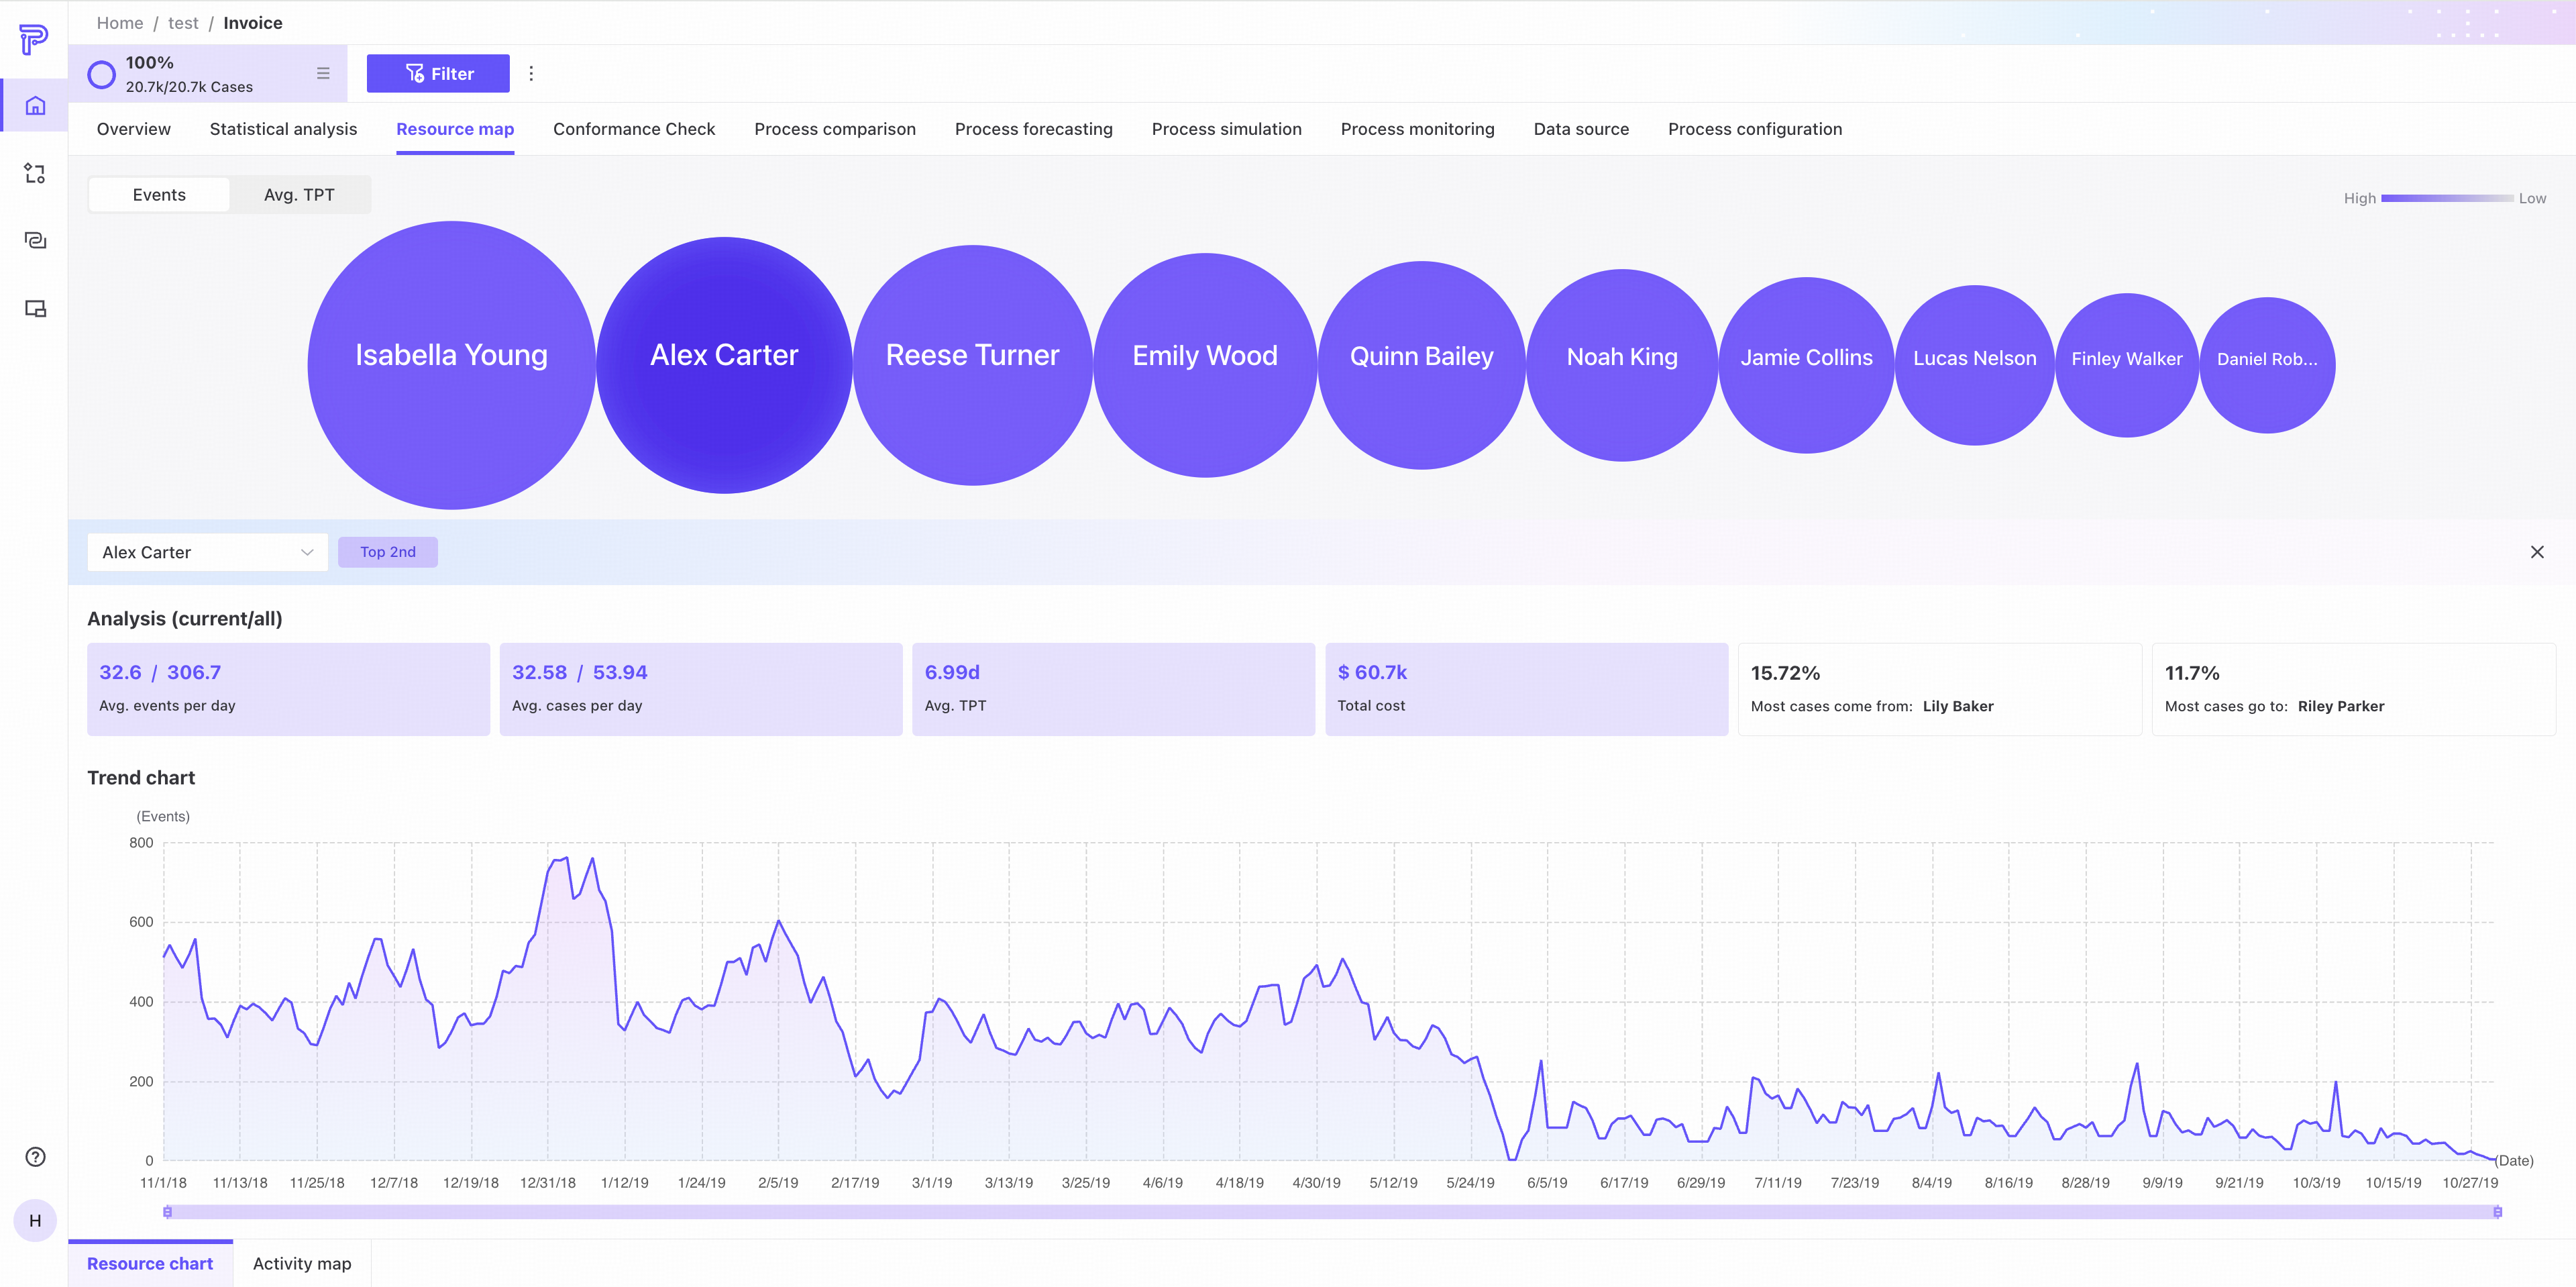
❷ Hover over a bubble to see the resource name, event count, and sequence. Click it to open a panel from below showing its ranking, analysis data, and trend chart. Click another bubble or use the dropdown to switch resources quickly.
❸ View controls: choose the top or bottom 20, set how many resources to display (1–20), and zoom the view.
❹ Switch resource: opens the resource selection screen under Data source so you can change the Resource column.
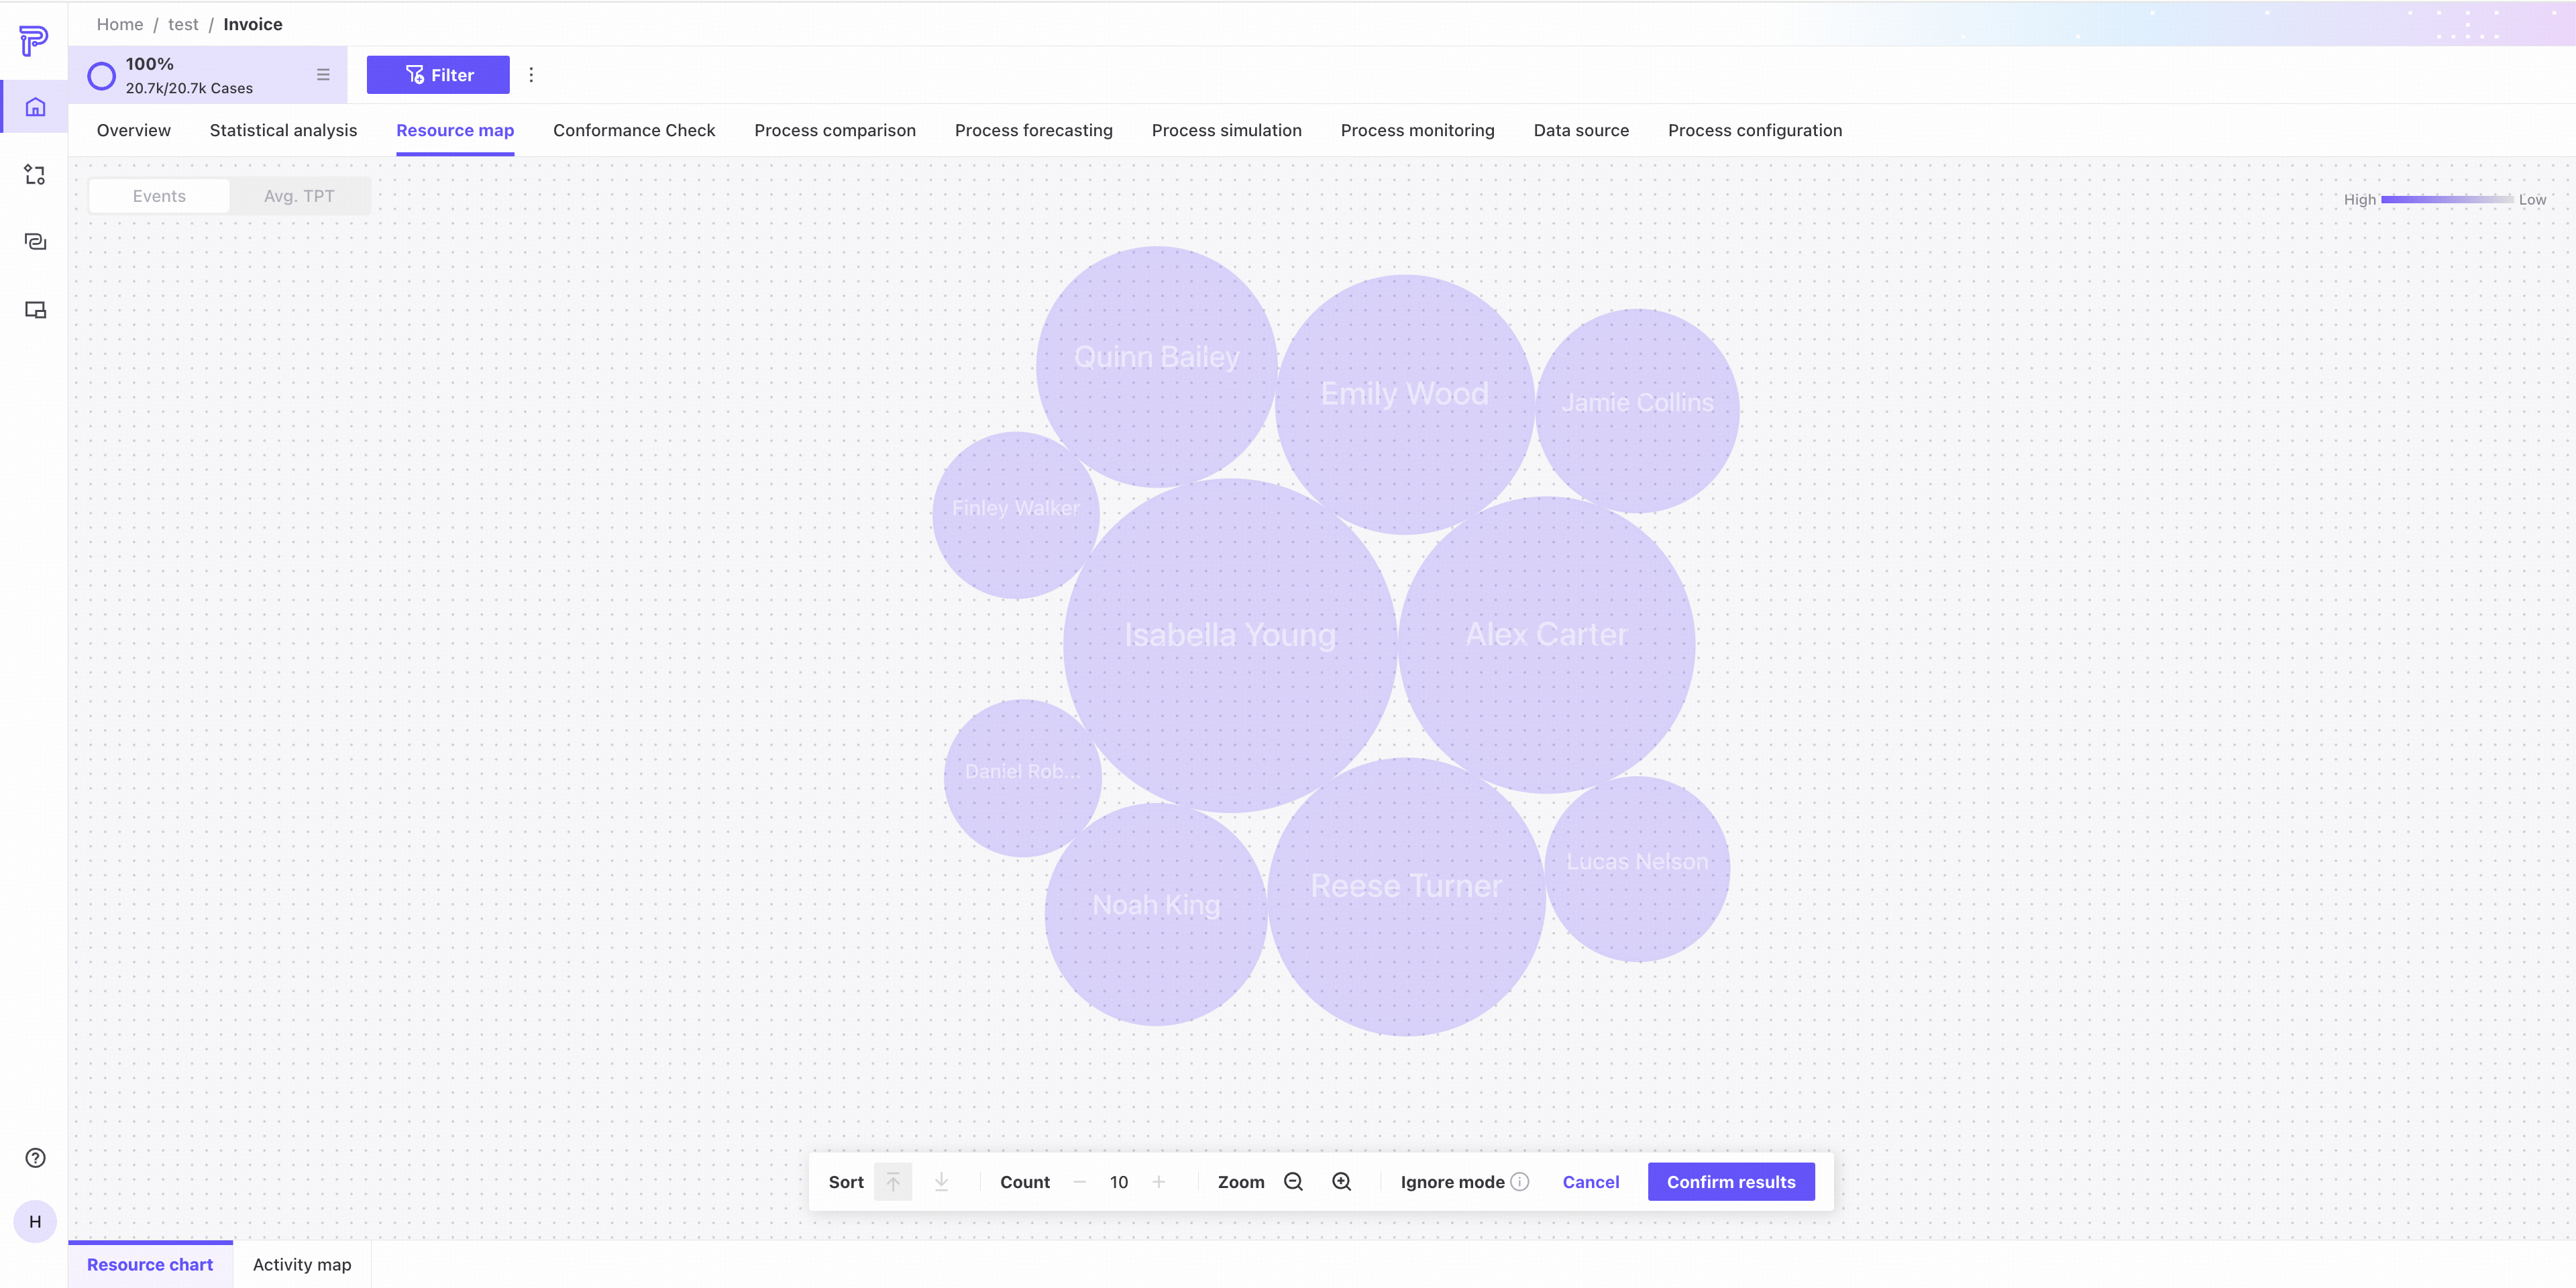
❺ Ignore mode: hover to see ignored resources. Click to open the ignore screen, select resource bubbles to ignore, then confirm to return to Resource map. Selected resources are hidden. To show them again, click them again in Ignore mode.
Activity map
Activity map shows the activities associated with each resource and the resources associated with each activity.
- Color intensity indicates the data volume for activities and resources.
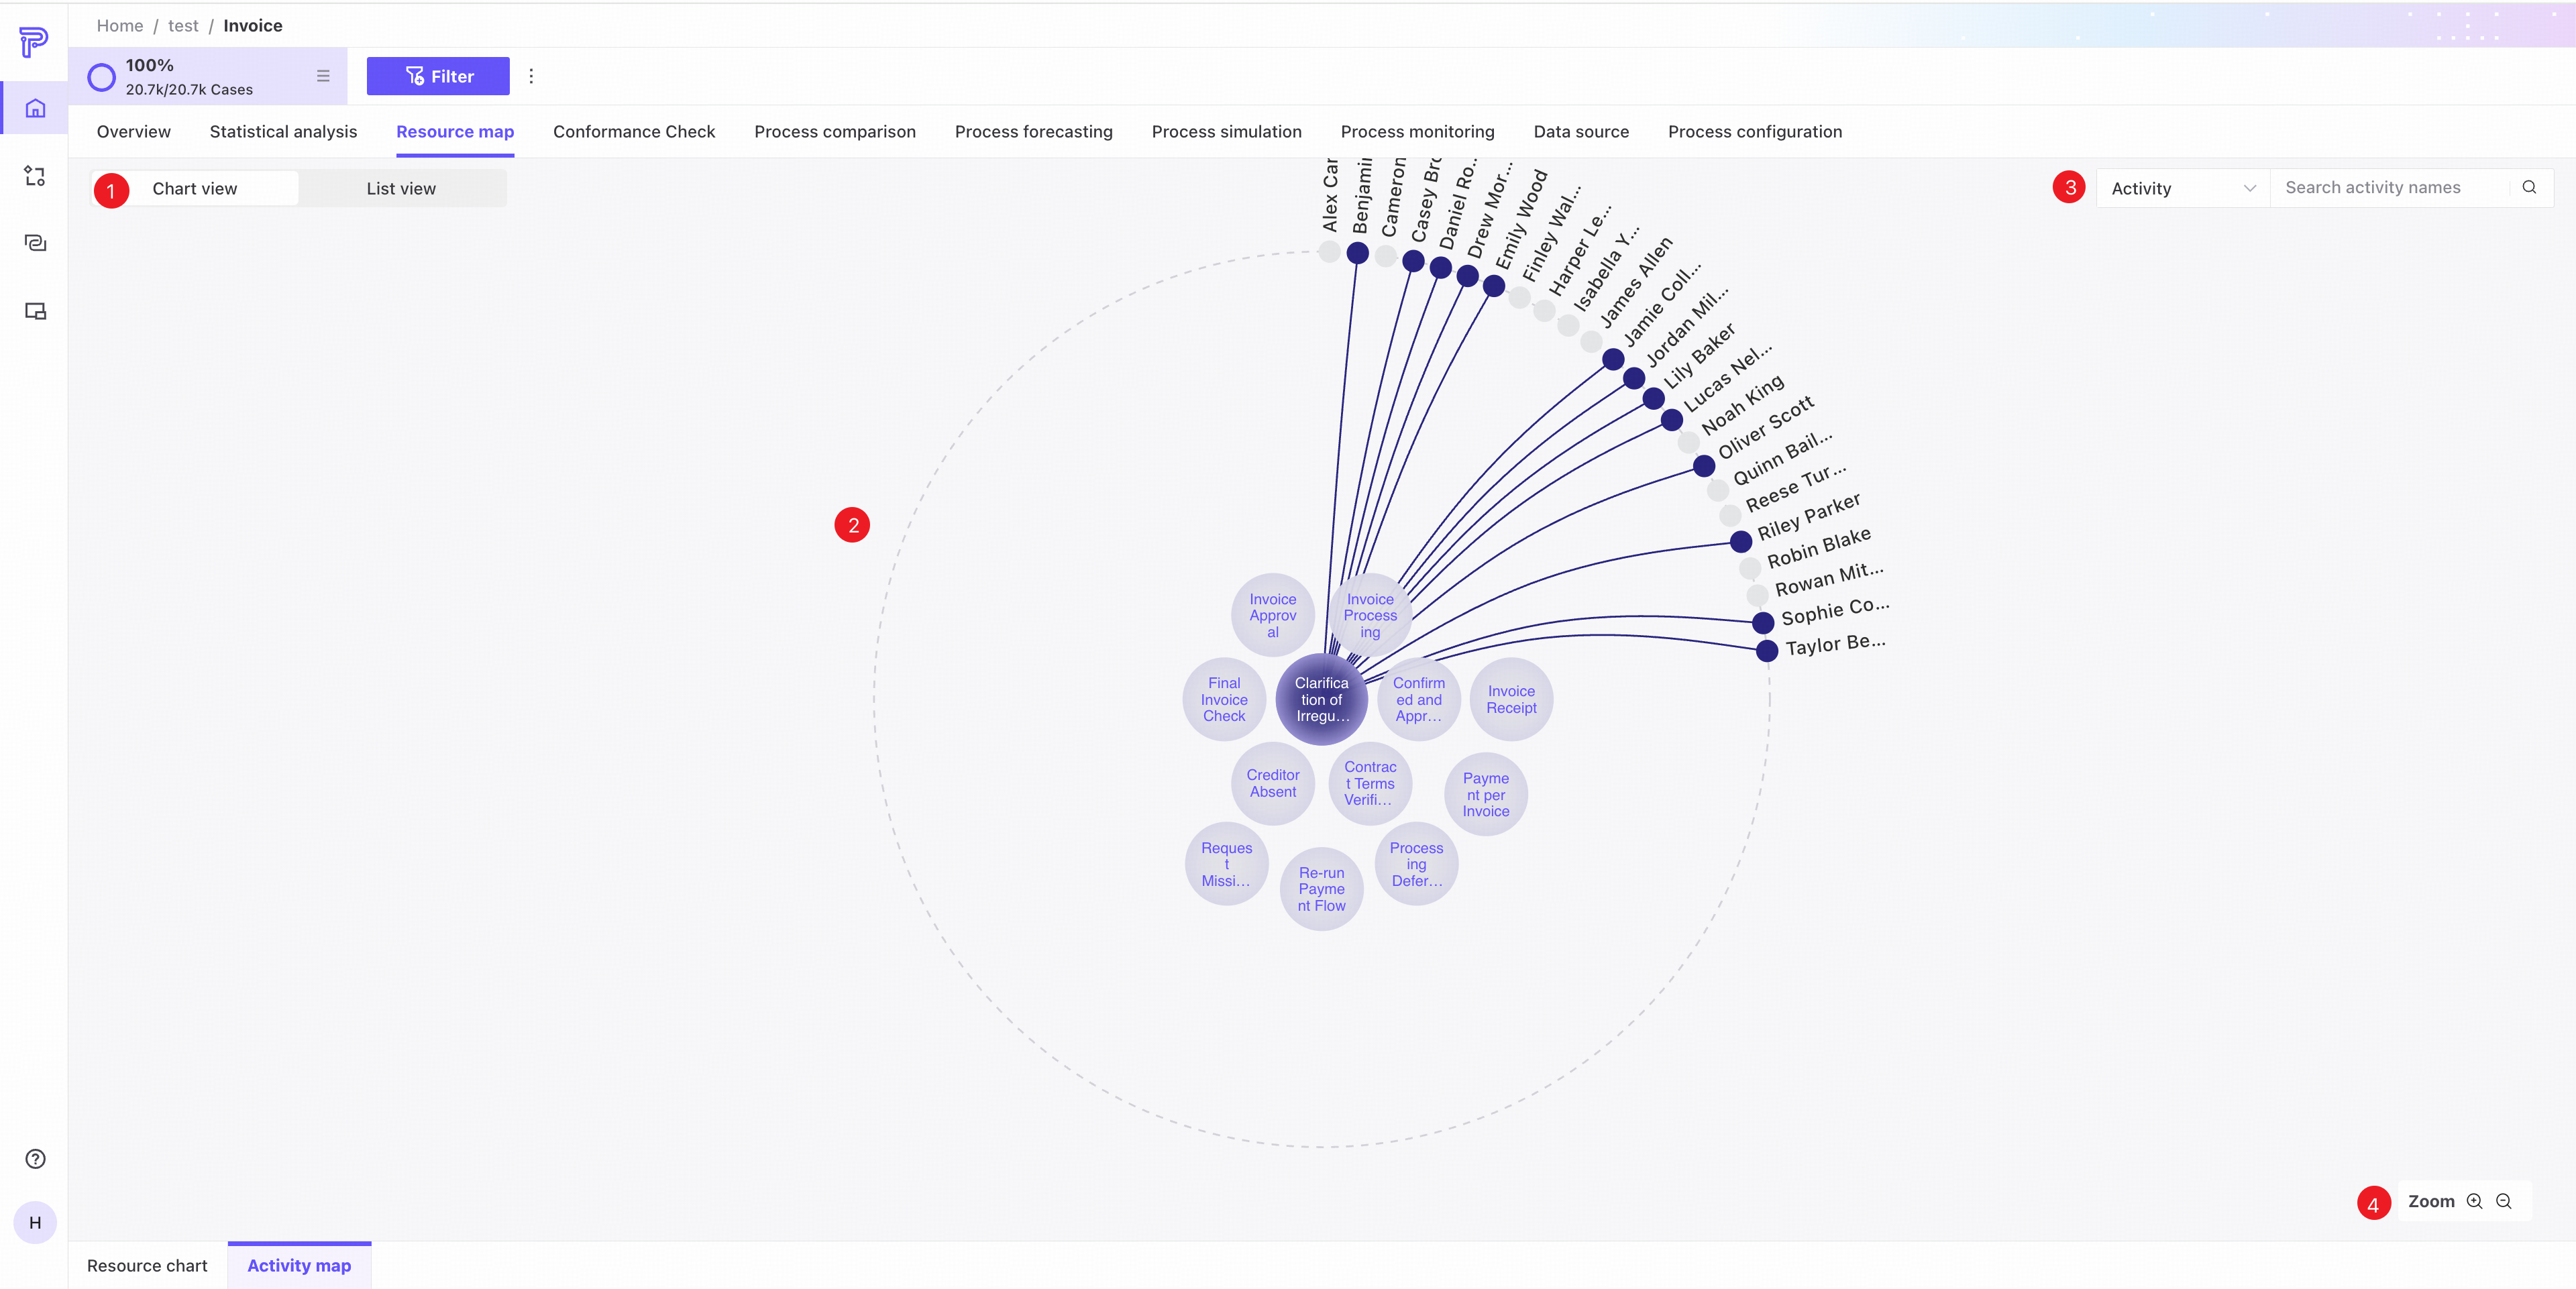
❶ Switch between chart and list views.
❷ Click an activity bubble in the center or a resource bubble around the edge to connect it to related resources or activities. Select up to three activities or resources at a time.
❸ Search: choose Activity or Resource in the left dropdown, then enter a keyword to display all matching names.
❹ Zoom controls for the current view.
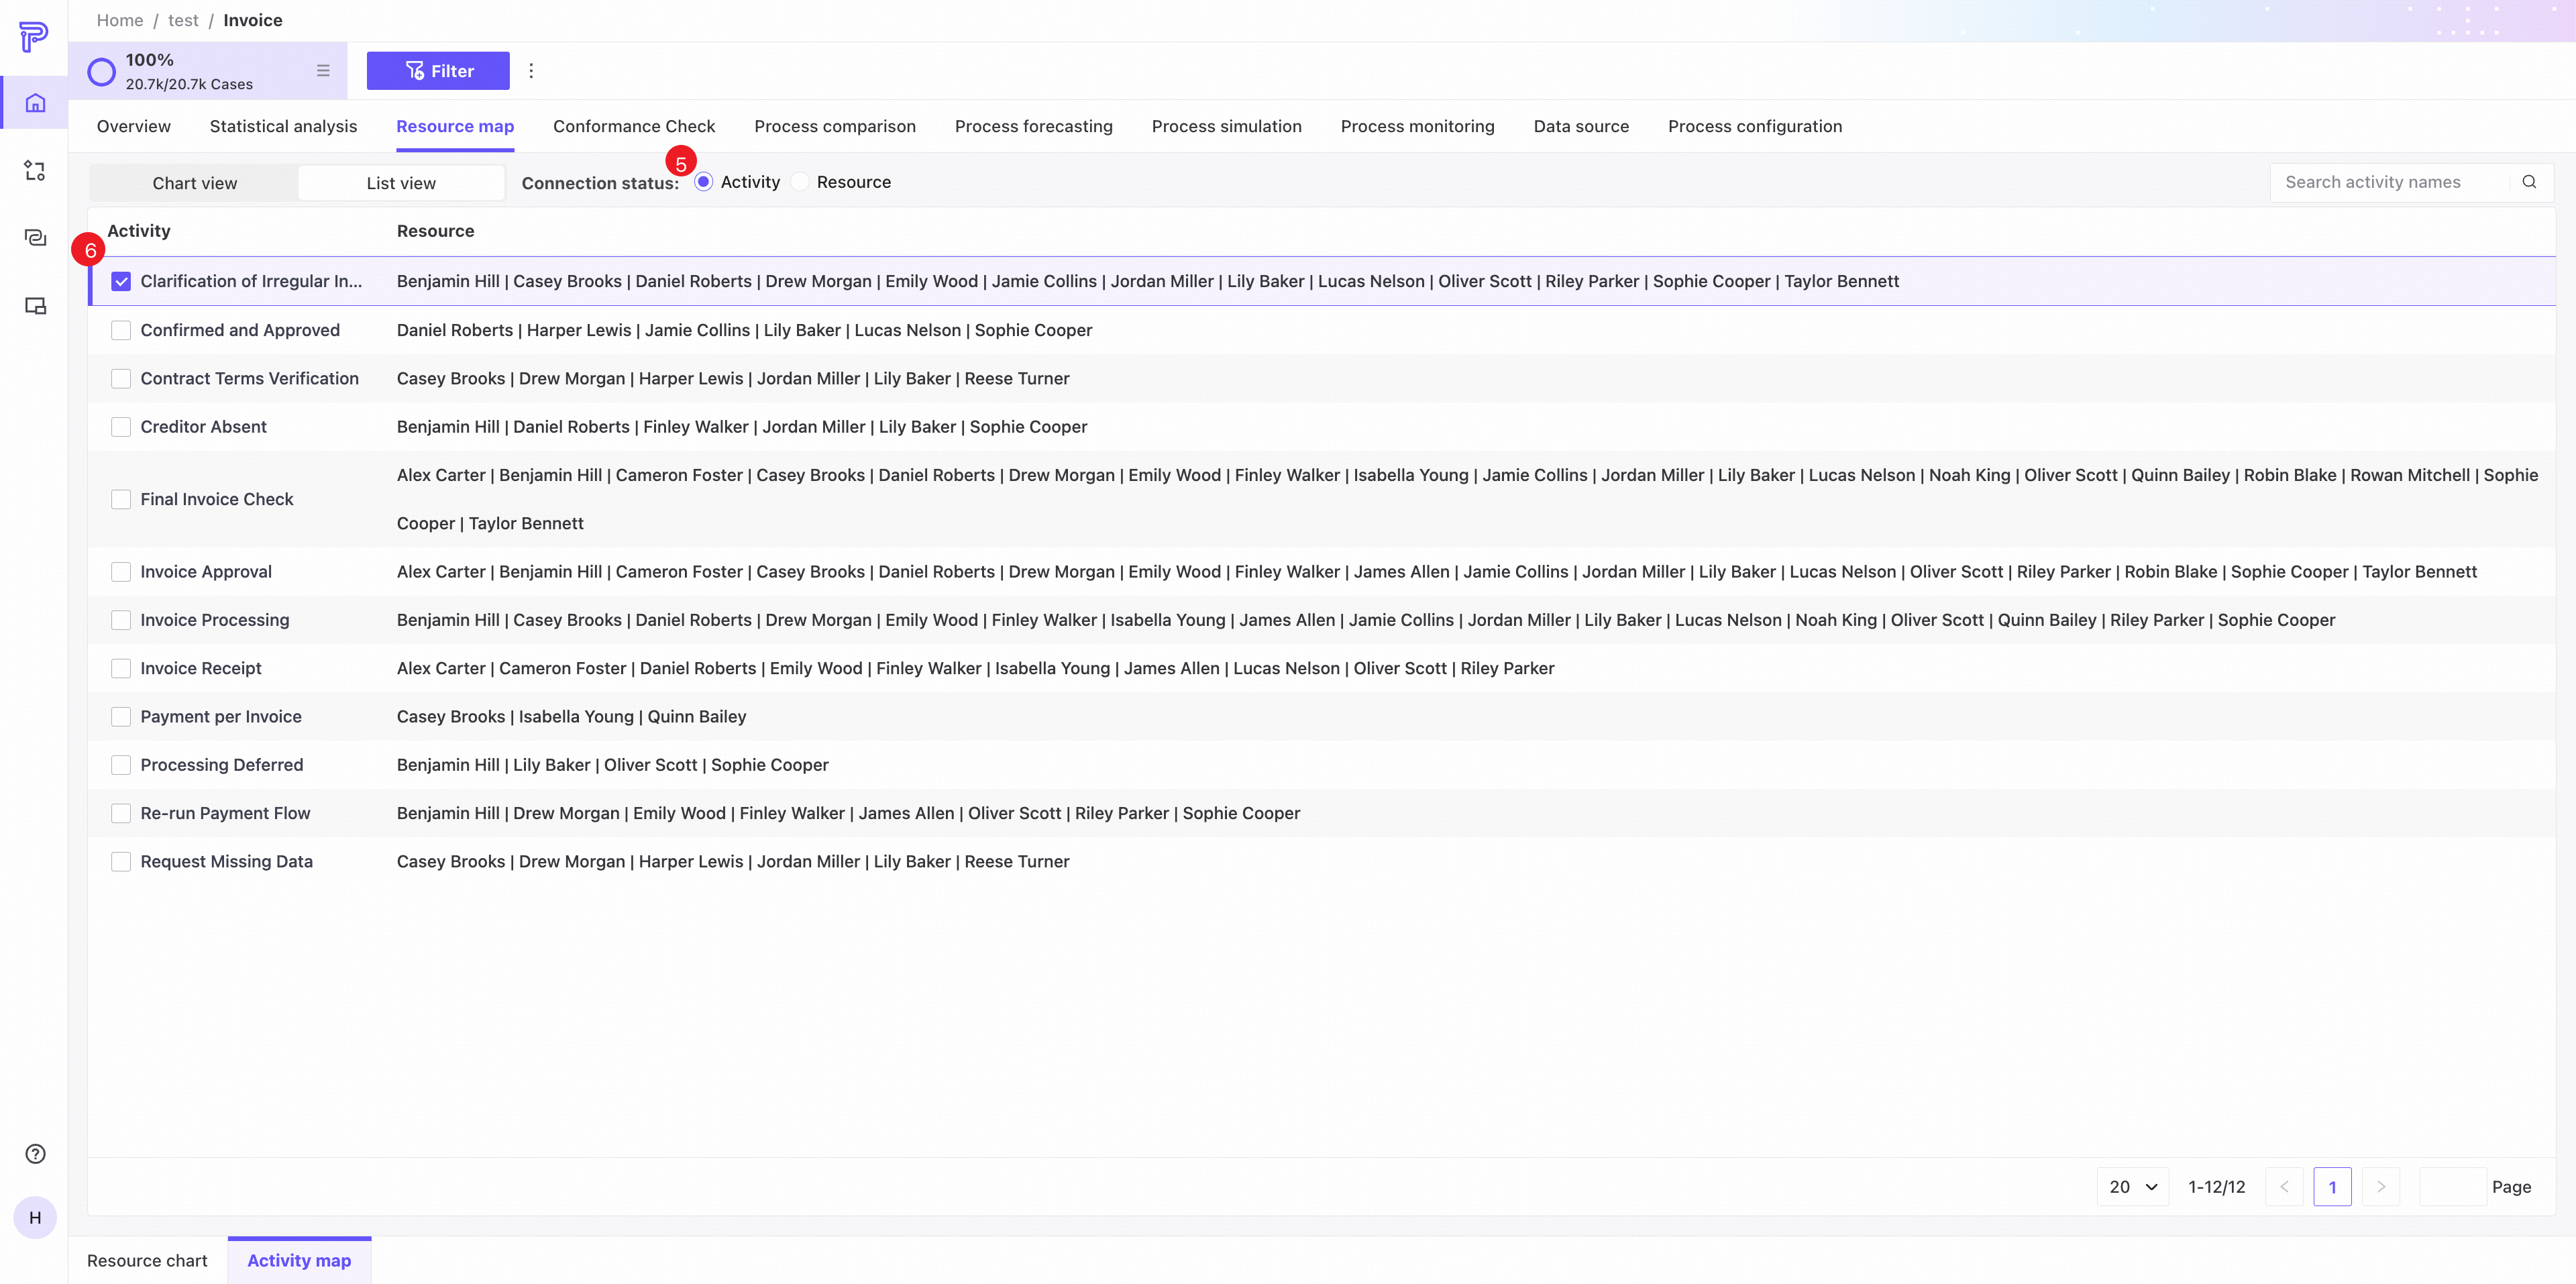
❺ Attribute selection: click an activity or resource to update the left column and show its related resources or activities.
❻ Selecting a checkbox also selects the corresponding item in the chart on the left. Select up to three items.
Activity map displays up to 350 activities and 500 resources.
When there are more than 300 resources, connections between resources and activities are hidden to keep the chart readable.
If either limit is exceeded, the chart is hidden and data is available only in list view.
Resource data
The resource list shows detailed measures, including case count, event count, activities, earliest start time, and latest end time for each resource.
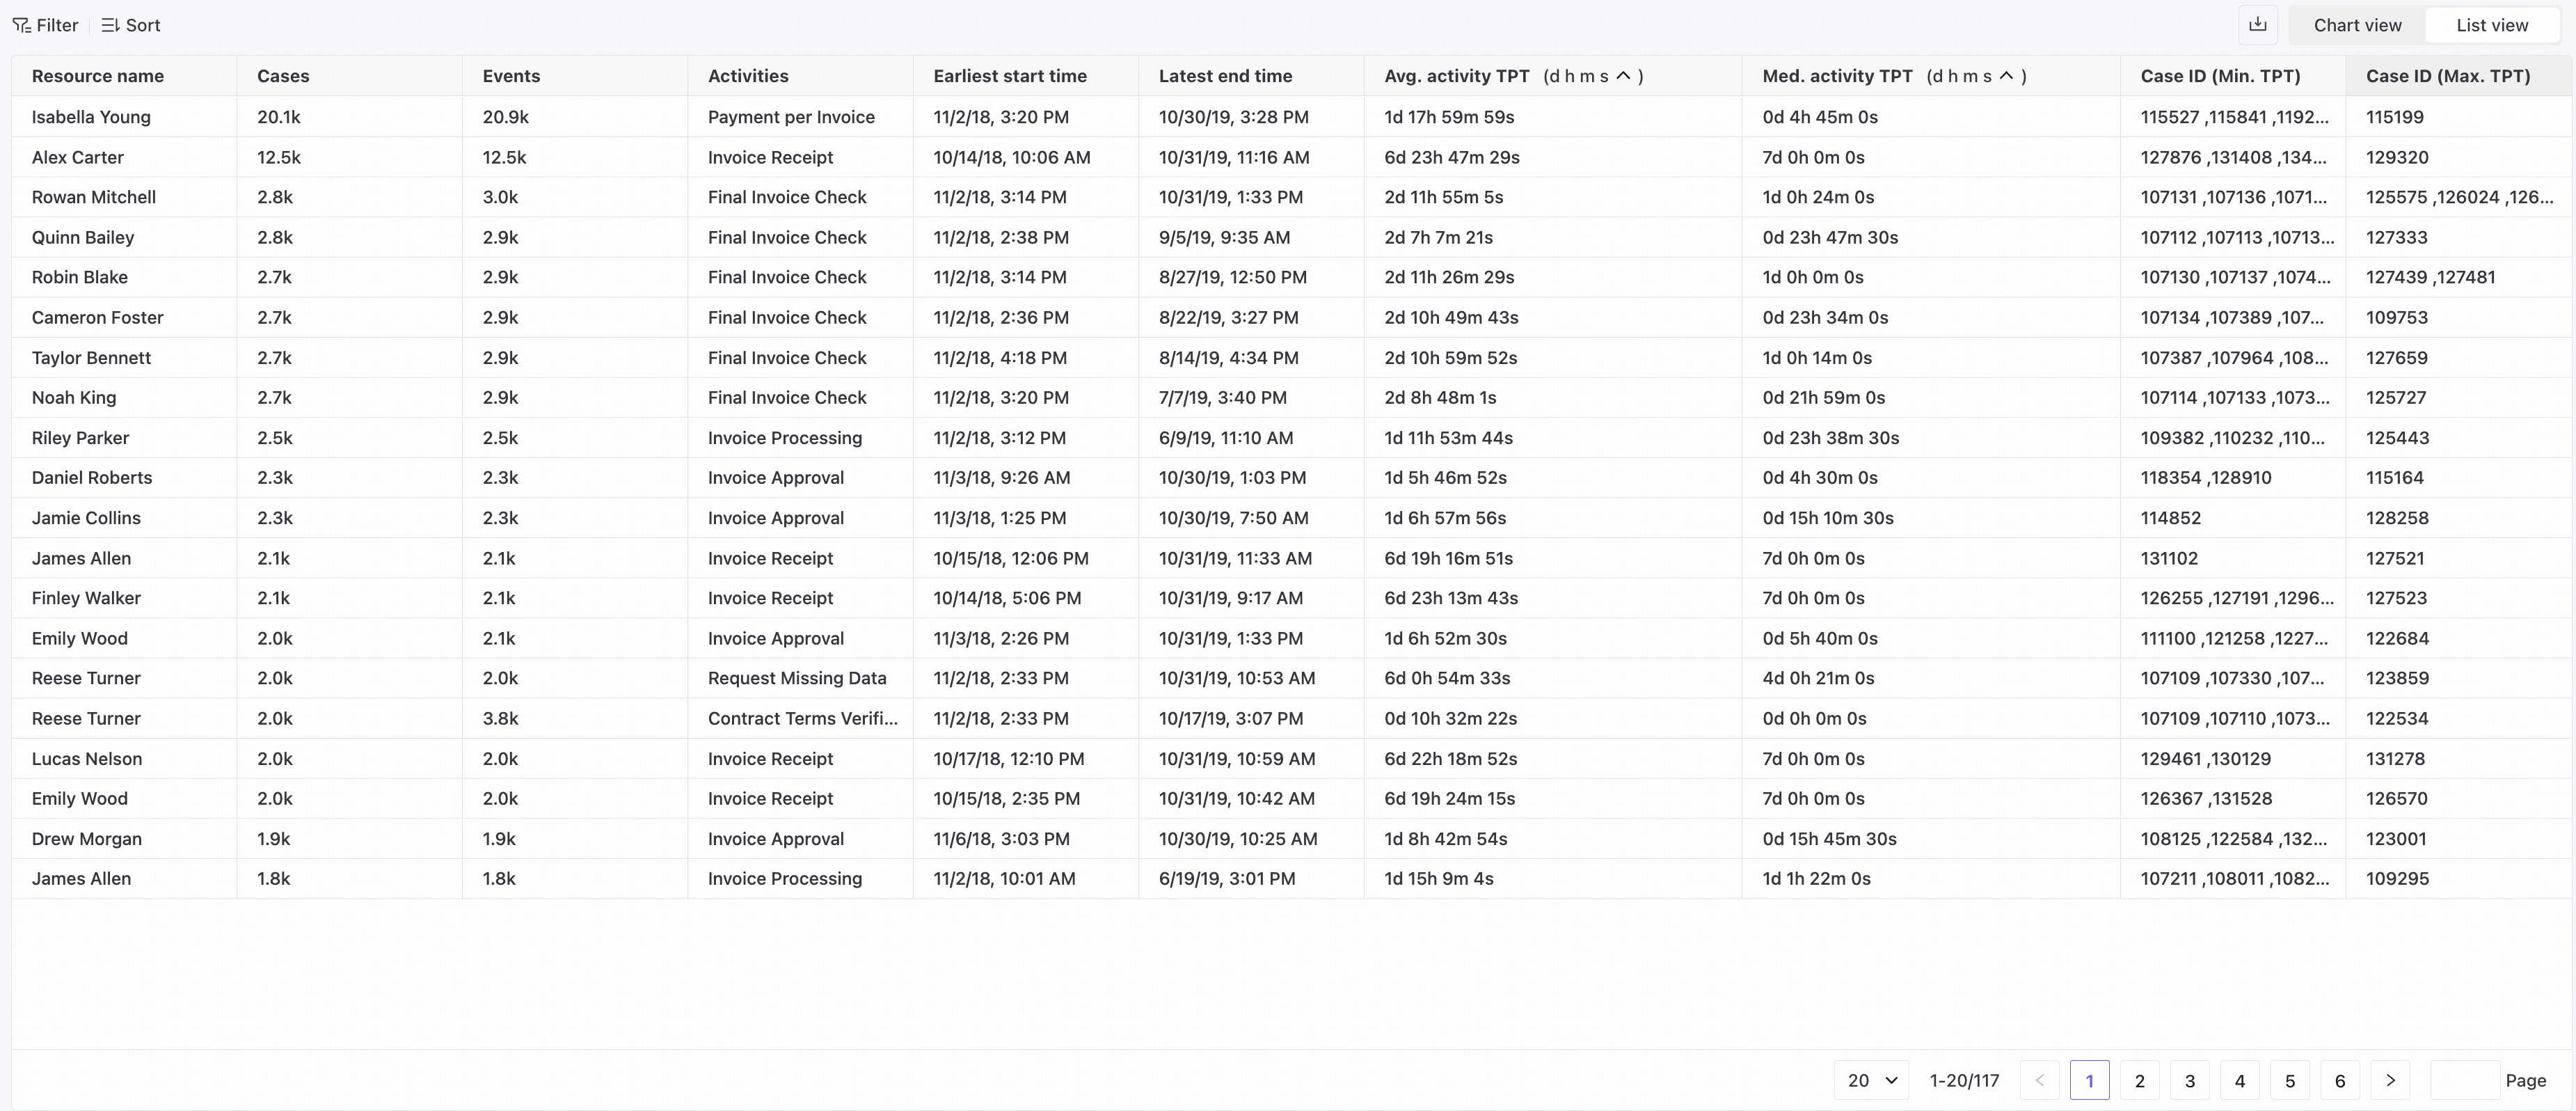
Click Download to export the current data.
- Filters: filter by available list columns.
- Sorting: sort by available columns in ascending or descending order.