Process comparison
Overview
Compare process maps and KPIs for different conditions applied to the same process analysis data. Two process maps and their KPIs are displayed side by side by default.
- Apply separate filters to each side to compare the resulting maps and KPIs.
- Switch between analytical dimensions.
- Adjust process map complexity, zoom in or out, and use full-screen mode.
Filters for each view of the same event log are independent; each filter set produces its own process map.
Features
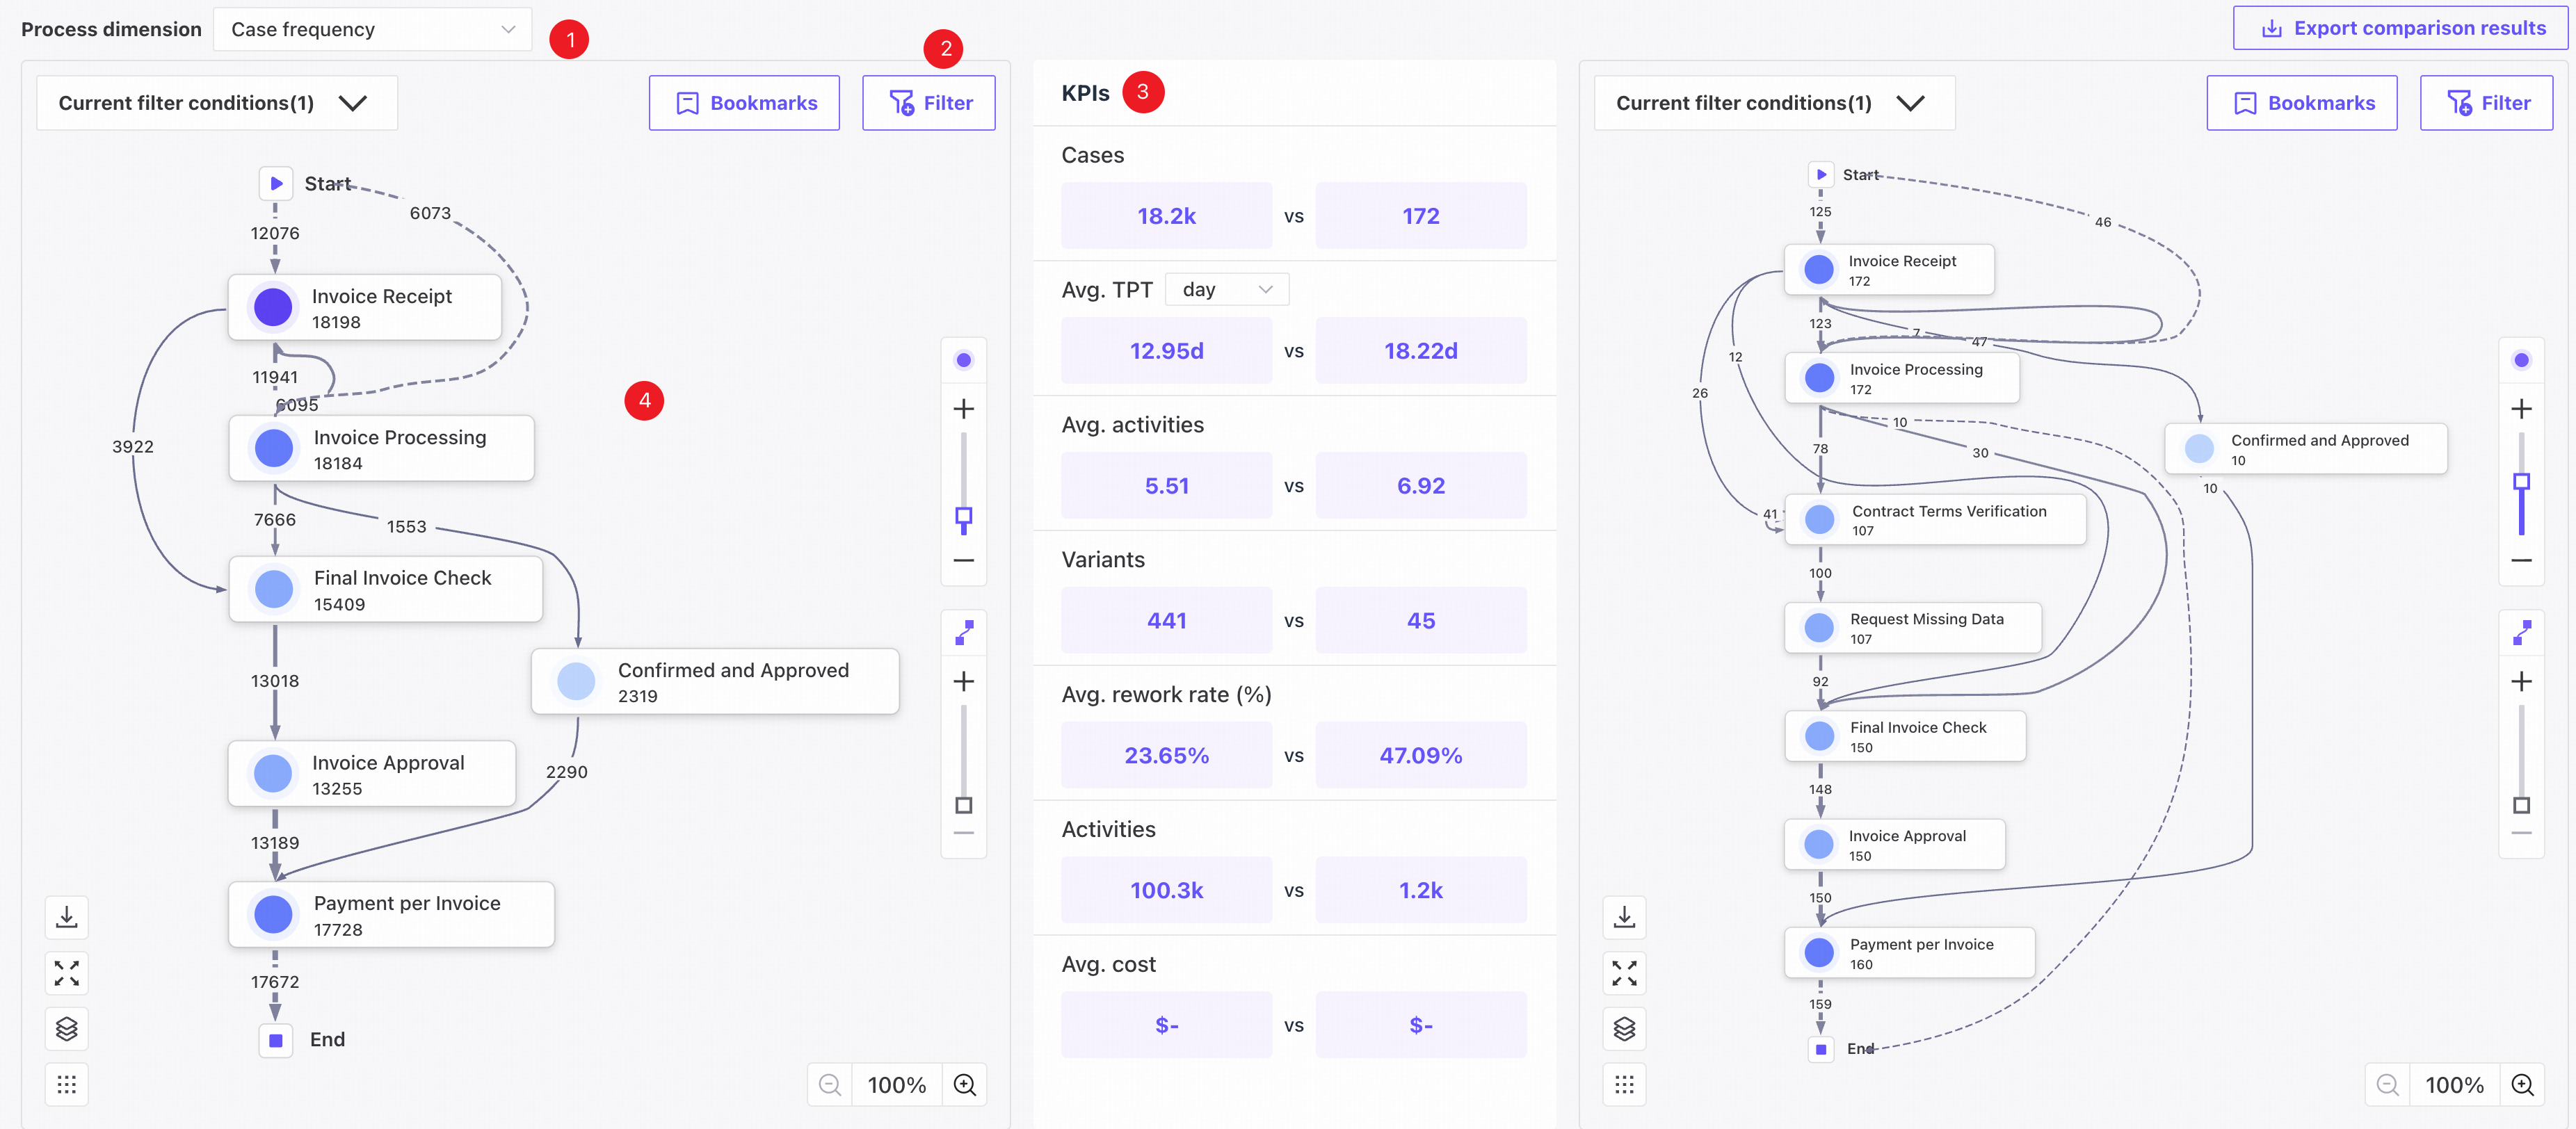
❶ Switch between case frequency, activity frequency, rework rate, and average throughput time to update the maps and KPIs.
❷ Add filters to analyze different subsets. For details, see Filter conditions.
❸ View cases, activities, average activities, average rework rate, variants, and average throughput time under the current filters.
❹ The most frequent variant is displayed by default. Each map reflects its own filter conditions. For details, see Process map.
Display limits
For display behavior when node and edge counts exceed the limit, see Display limits.