Statistical analysis
Overview
Statistical analysis presents process performance quantitatively from multiple perspectives. It helps you understand behavior from the overall process down to individual details, identify potential issues, and make data-driven improvements. Charts and lists show key measures and structural characteristics.
- Pivot analysis: an overview dashboard of core measures, such as total cases, average activity duration, and resource distribution.
- Case, Edge, Activity, Variant, and Resource analysis: detailed perspectives for tracking trends, identifying bottlenecks, assessing complexity, and evaluating resource efficiency.
Flexible filtering and interactions let you focus on specific process segments or problem areas for more effective insights and continuous improvement.
Displayed results depend on the current filters. For details, see Filter conditions.
Features
Pivot analysis
Pivot analysis provides a KPI overview dashboard to help you quickly understand current process performance.
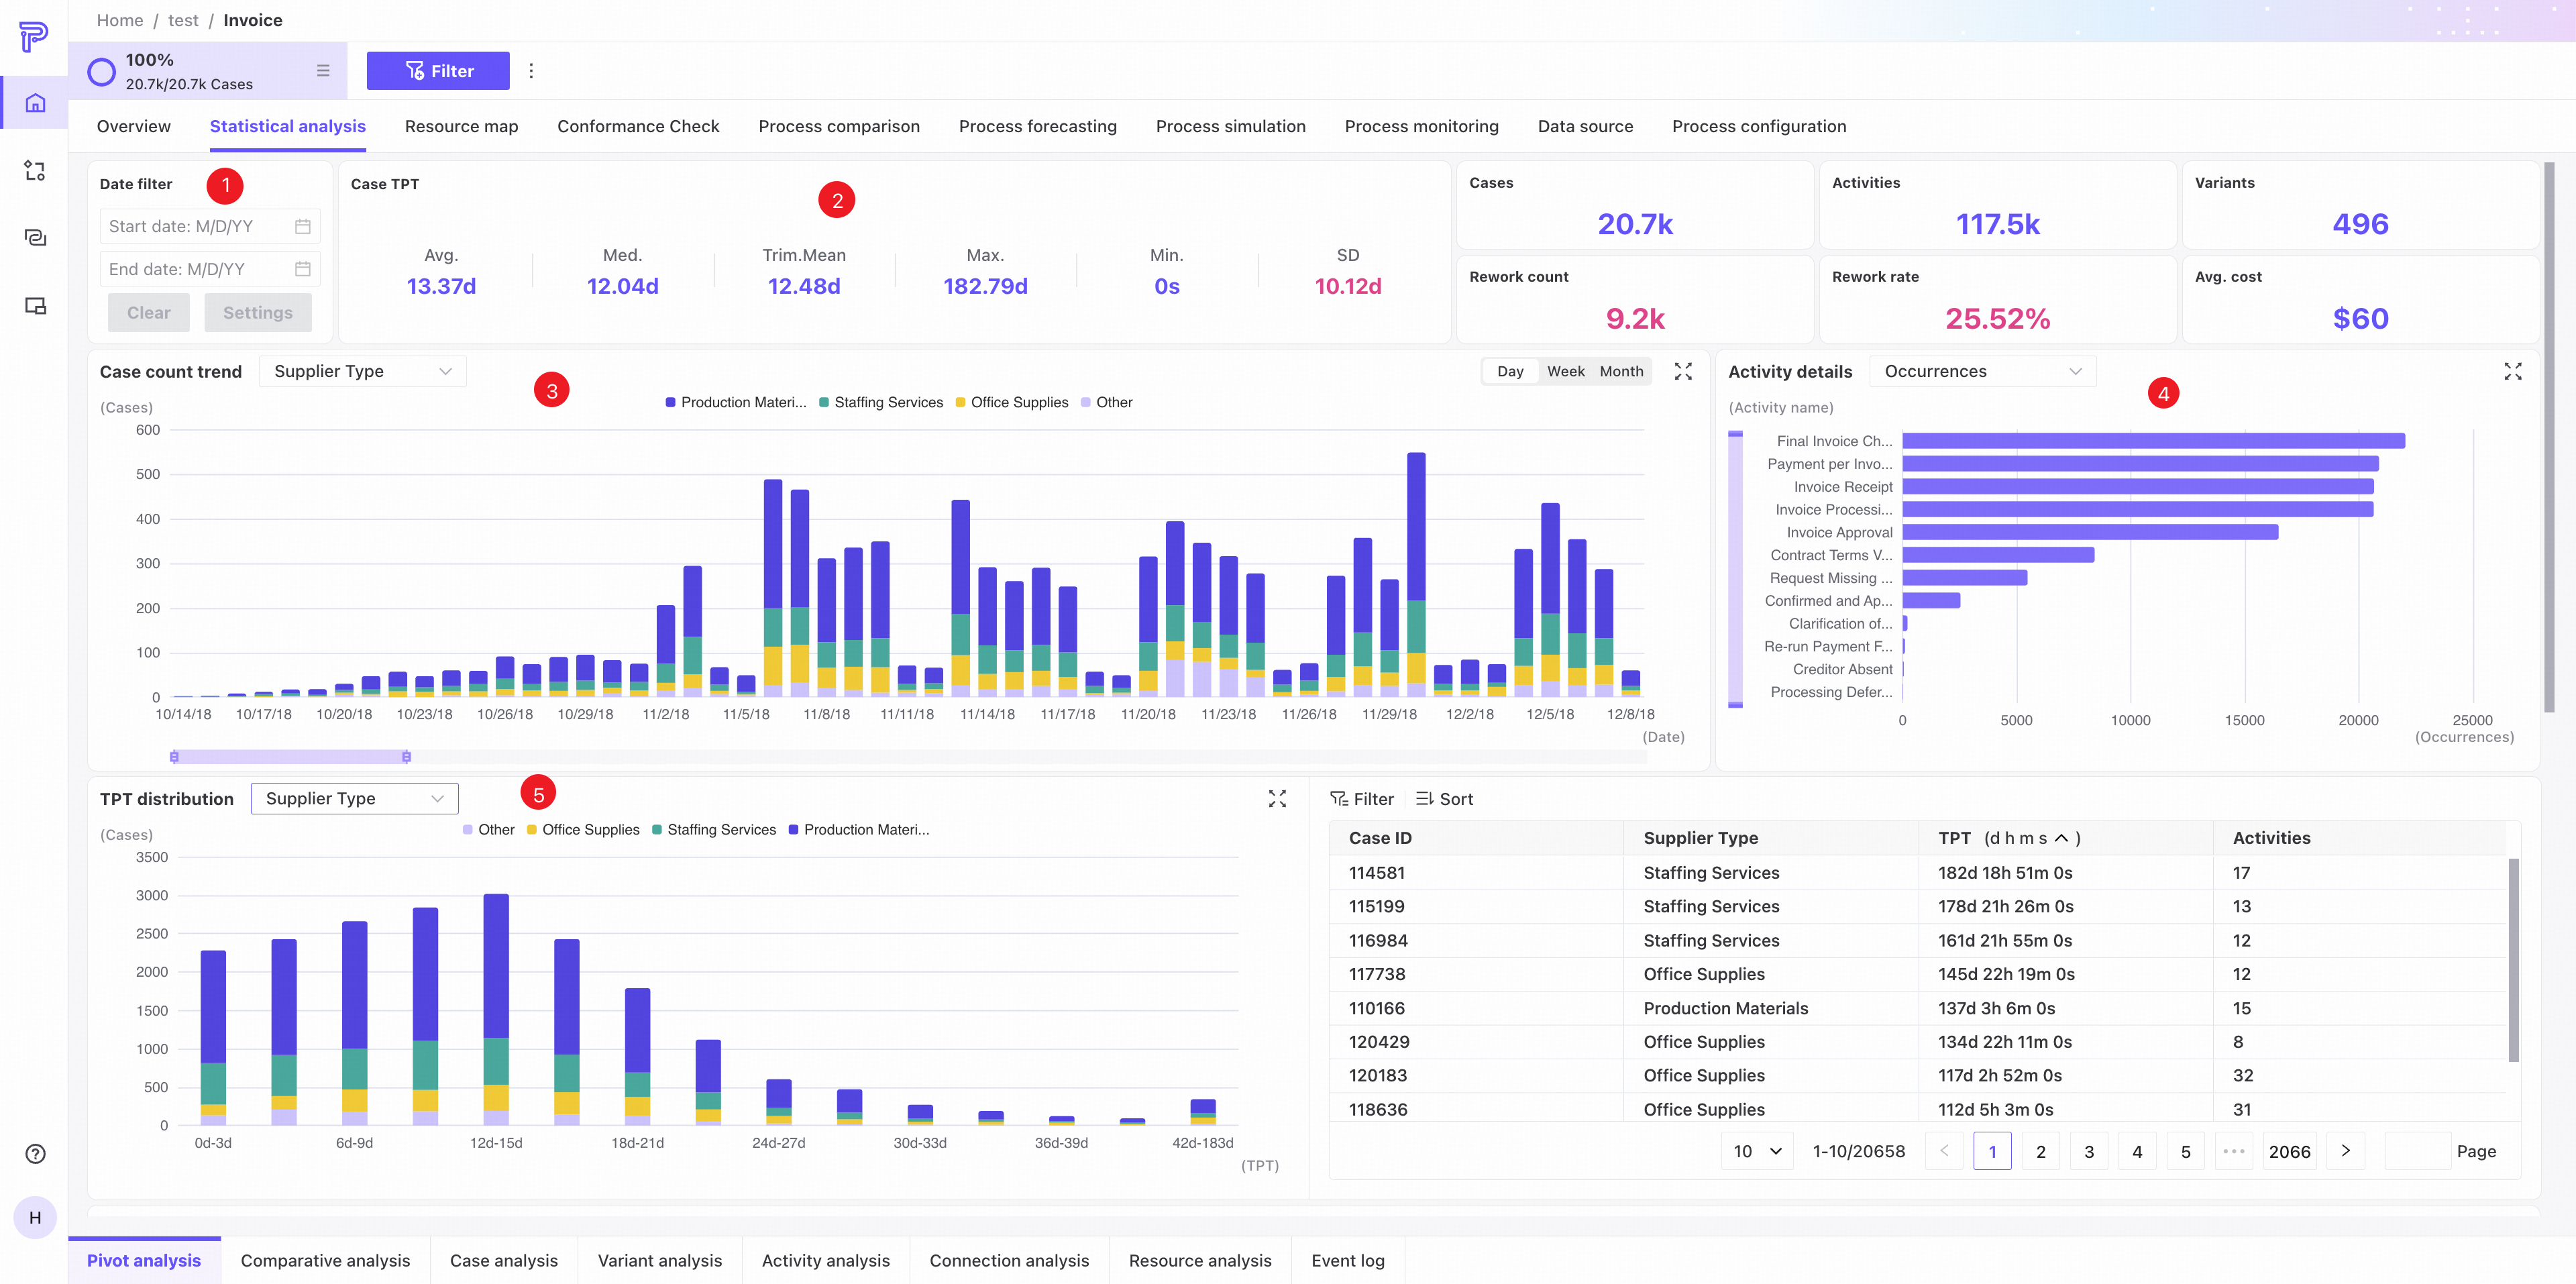
❶ Date filter: set a date range for the current dashboard.
❷ KPI area: displays core process KPIs.
❸ Case trend chart.
- Select a case attribute to see the distribution of cases across its values.
- Click a legend item to show or hide an attribute value.
- The chart shows the top three attribute values individually and groups all remaining values together.
❹ Activity frequency/throughput time statistics, sorted in descending order by default.
❺ Throughput time distribution.
- Select a case attribute to see throughput time distributions across its values.
- Click a legend item to show or hide an attribute value.
- The chart shows the top three attribute values individually and groups all remaining values together.
- Hover over a colored segment to add its attribute value and throughput time range to global filters for detailed analysis.
- Click a colored segment to filter the list on the right to the corresponding data.
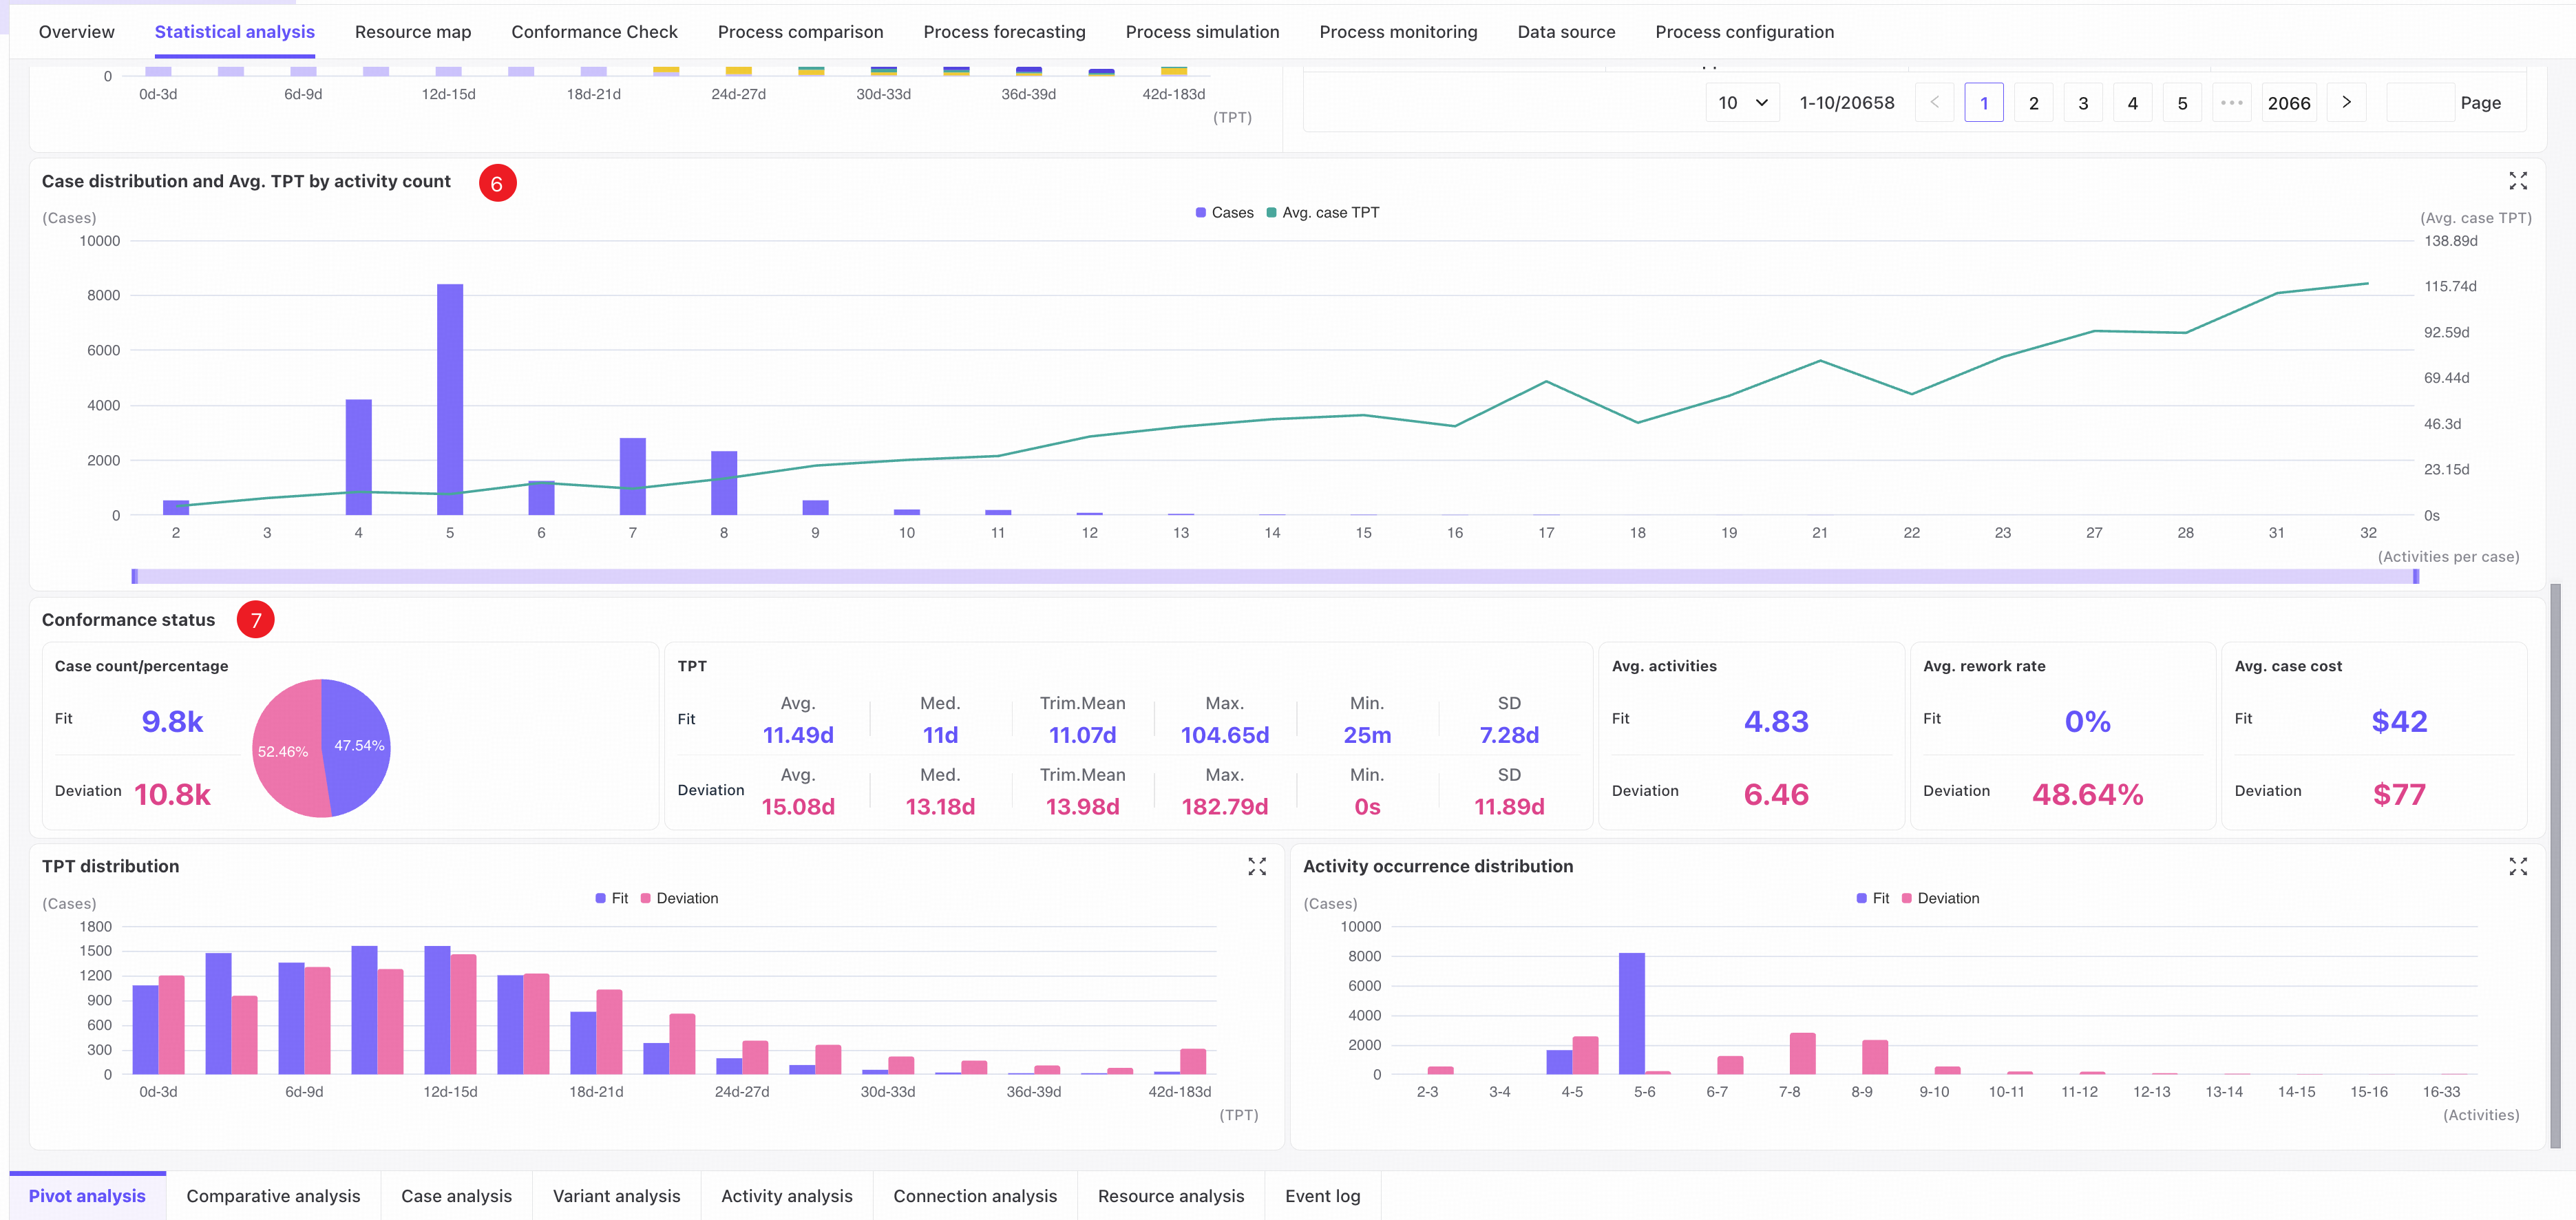
❻ Trends in case count and average case throughput time by activity count.
- Hover over a bar to add the corresponding activity count as a global filter condition.
❼ Conformance status: details of cases that conform or do not conform to the process model.
- KPI area: measures for conforming and nonconforming cases.
- Throughput time distribution: distributions for conforming and nonconforming cases.
- Activity frequency distribution: distributions for conforming and nonconforming cases.
Comparison analysis
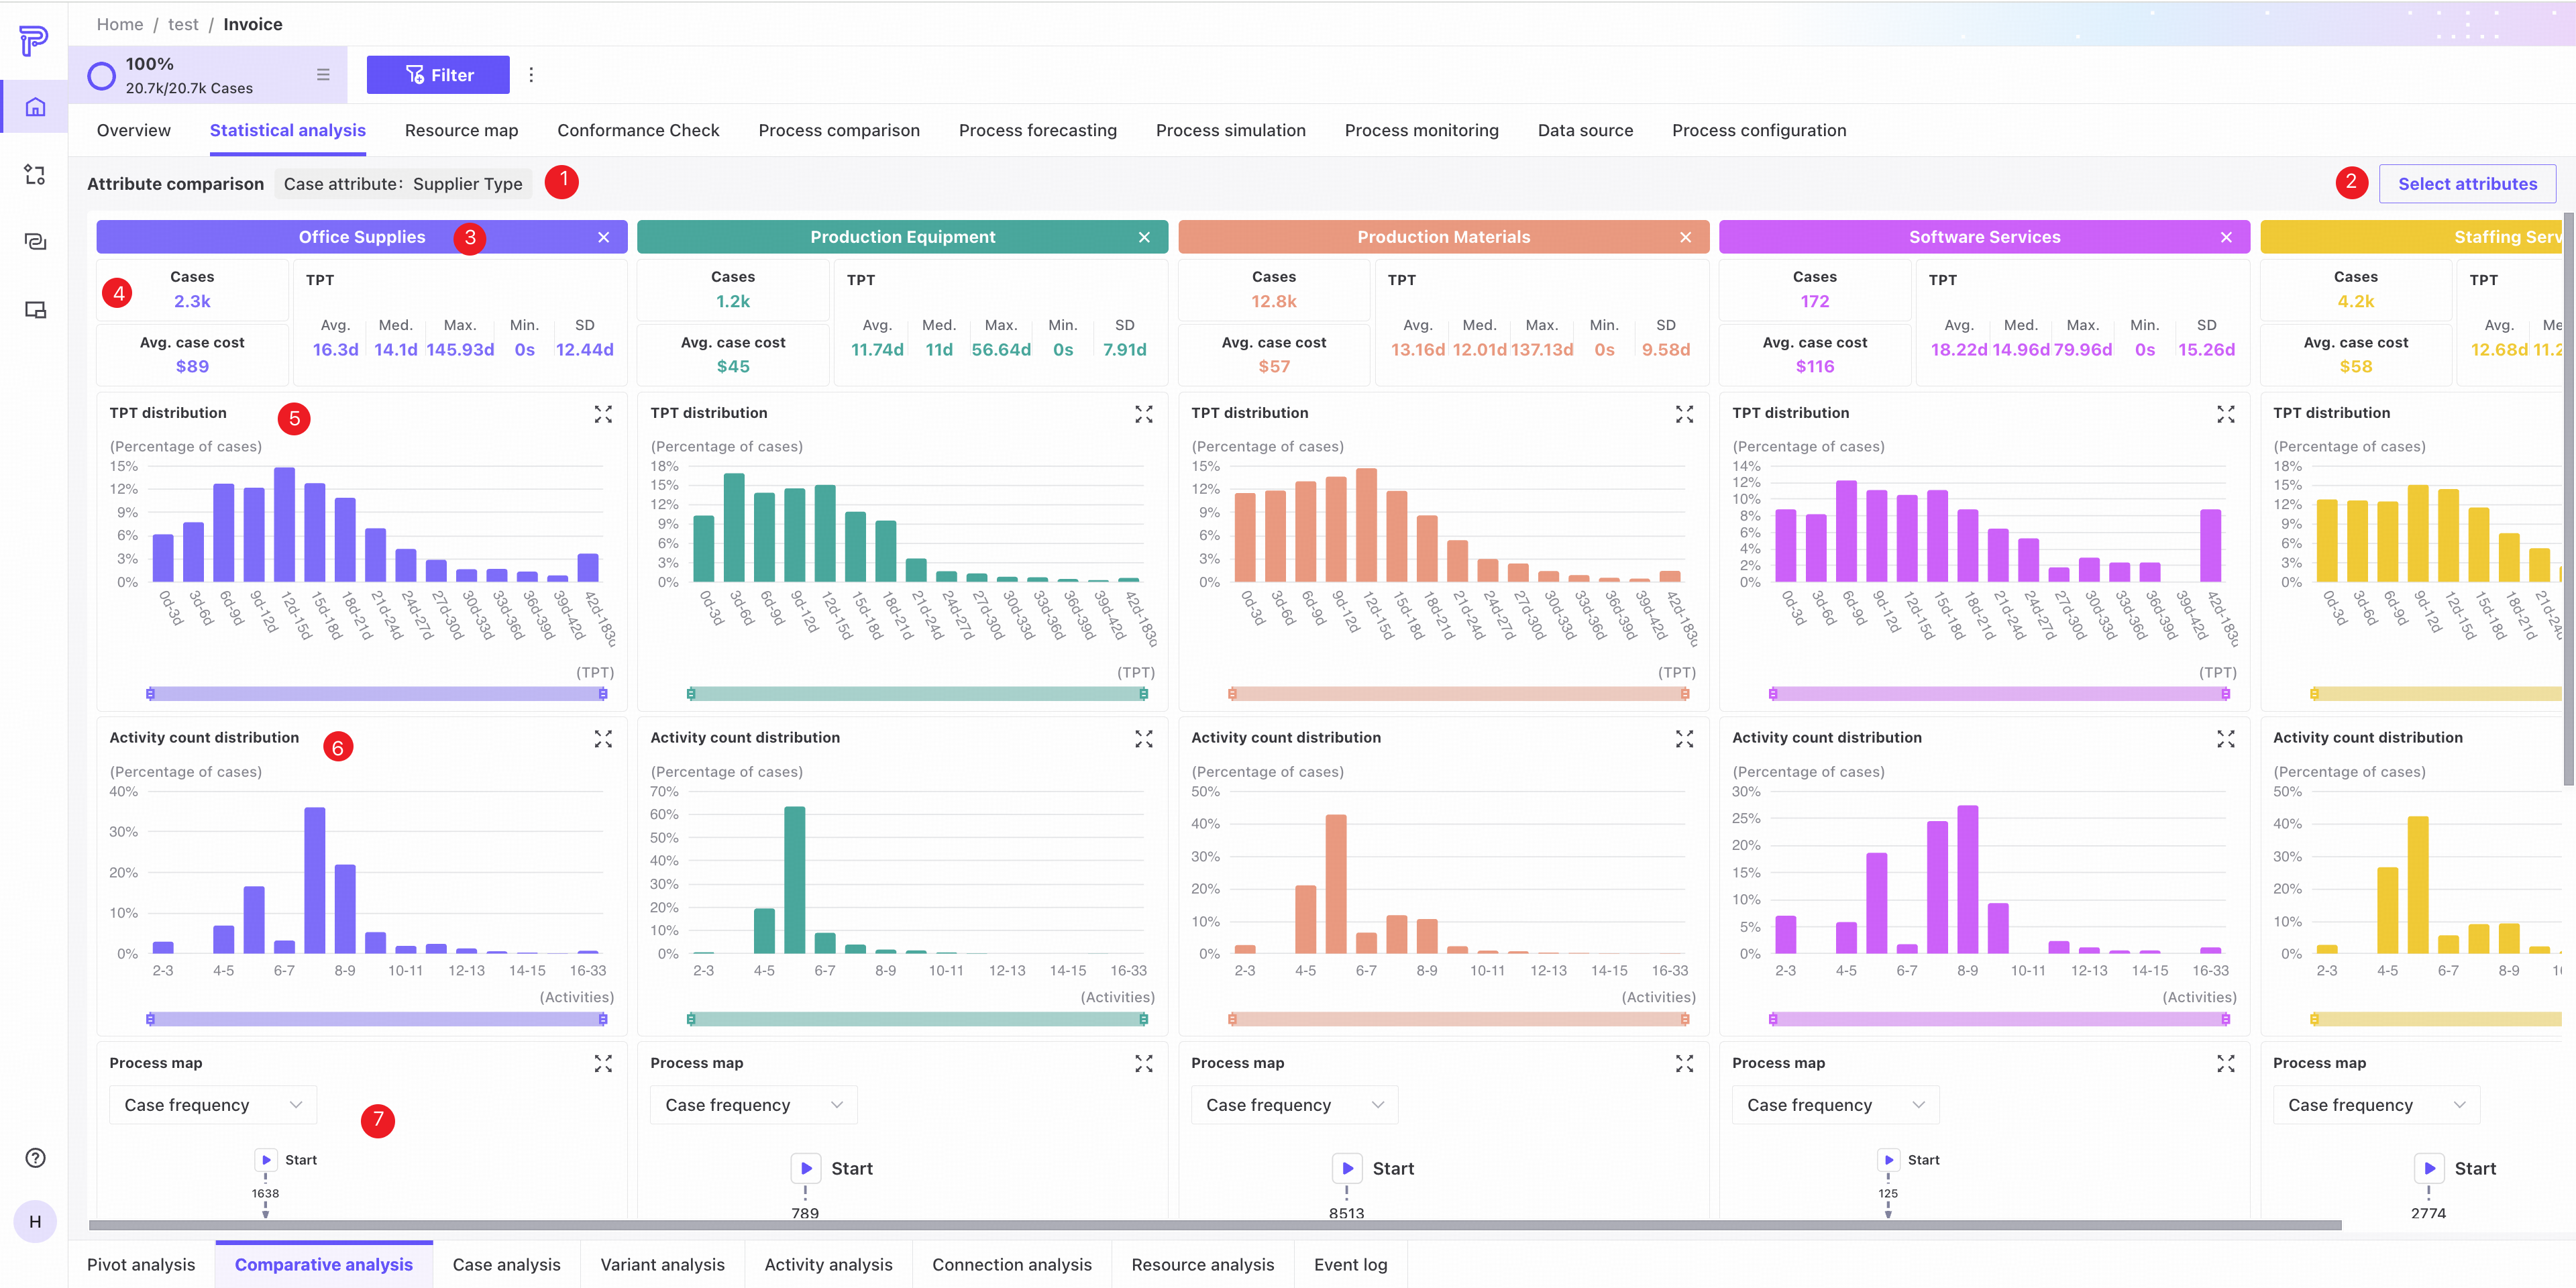
Select an attribute to compare measures for cases or events with different values in that dimension.
Comparison view
Case attributes
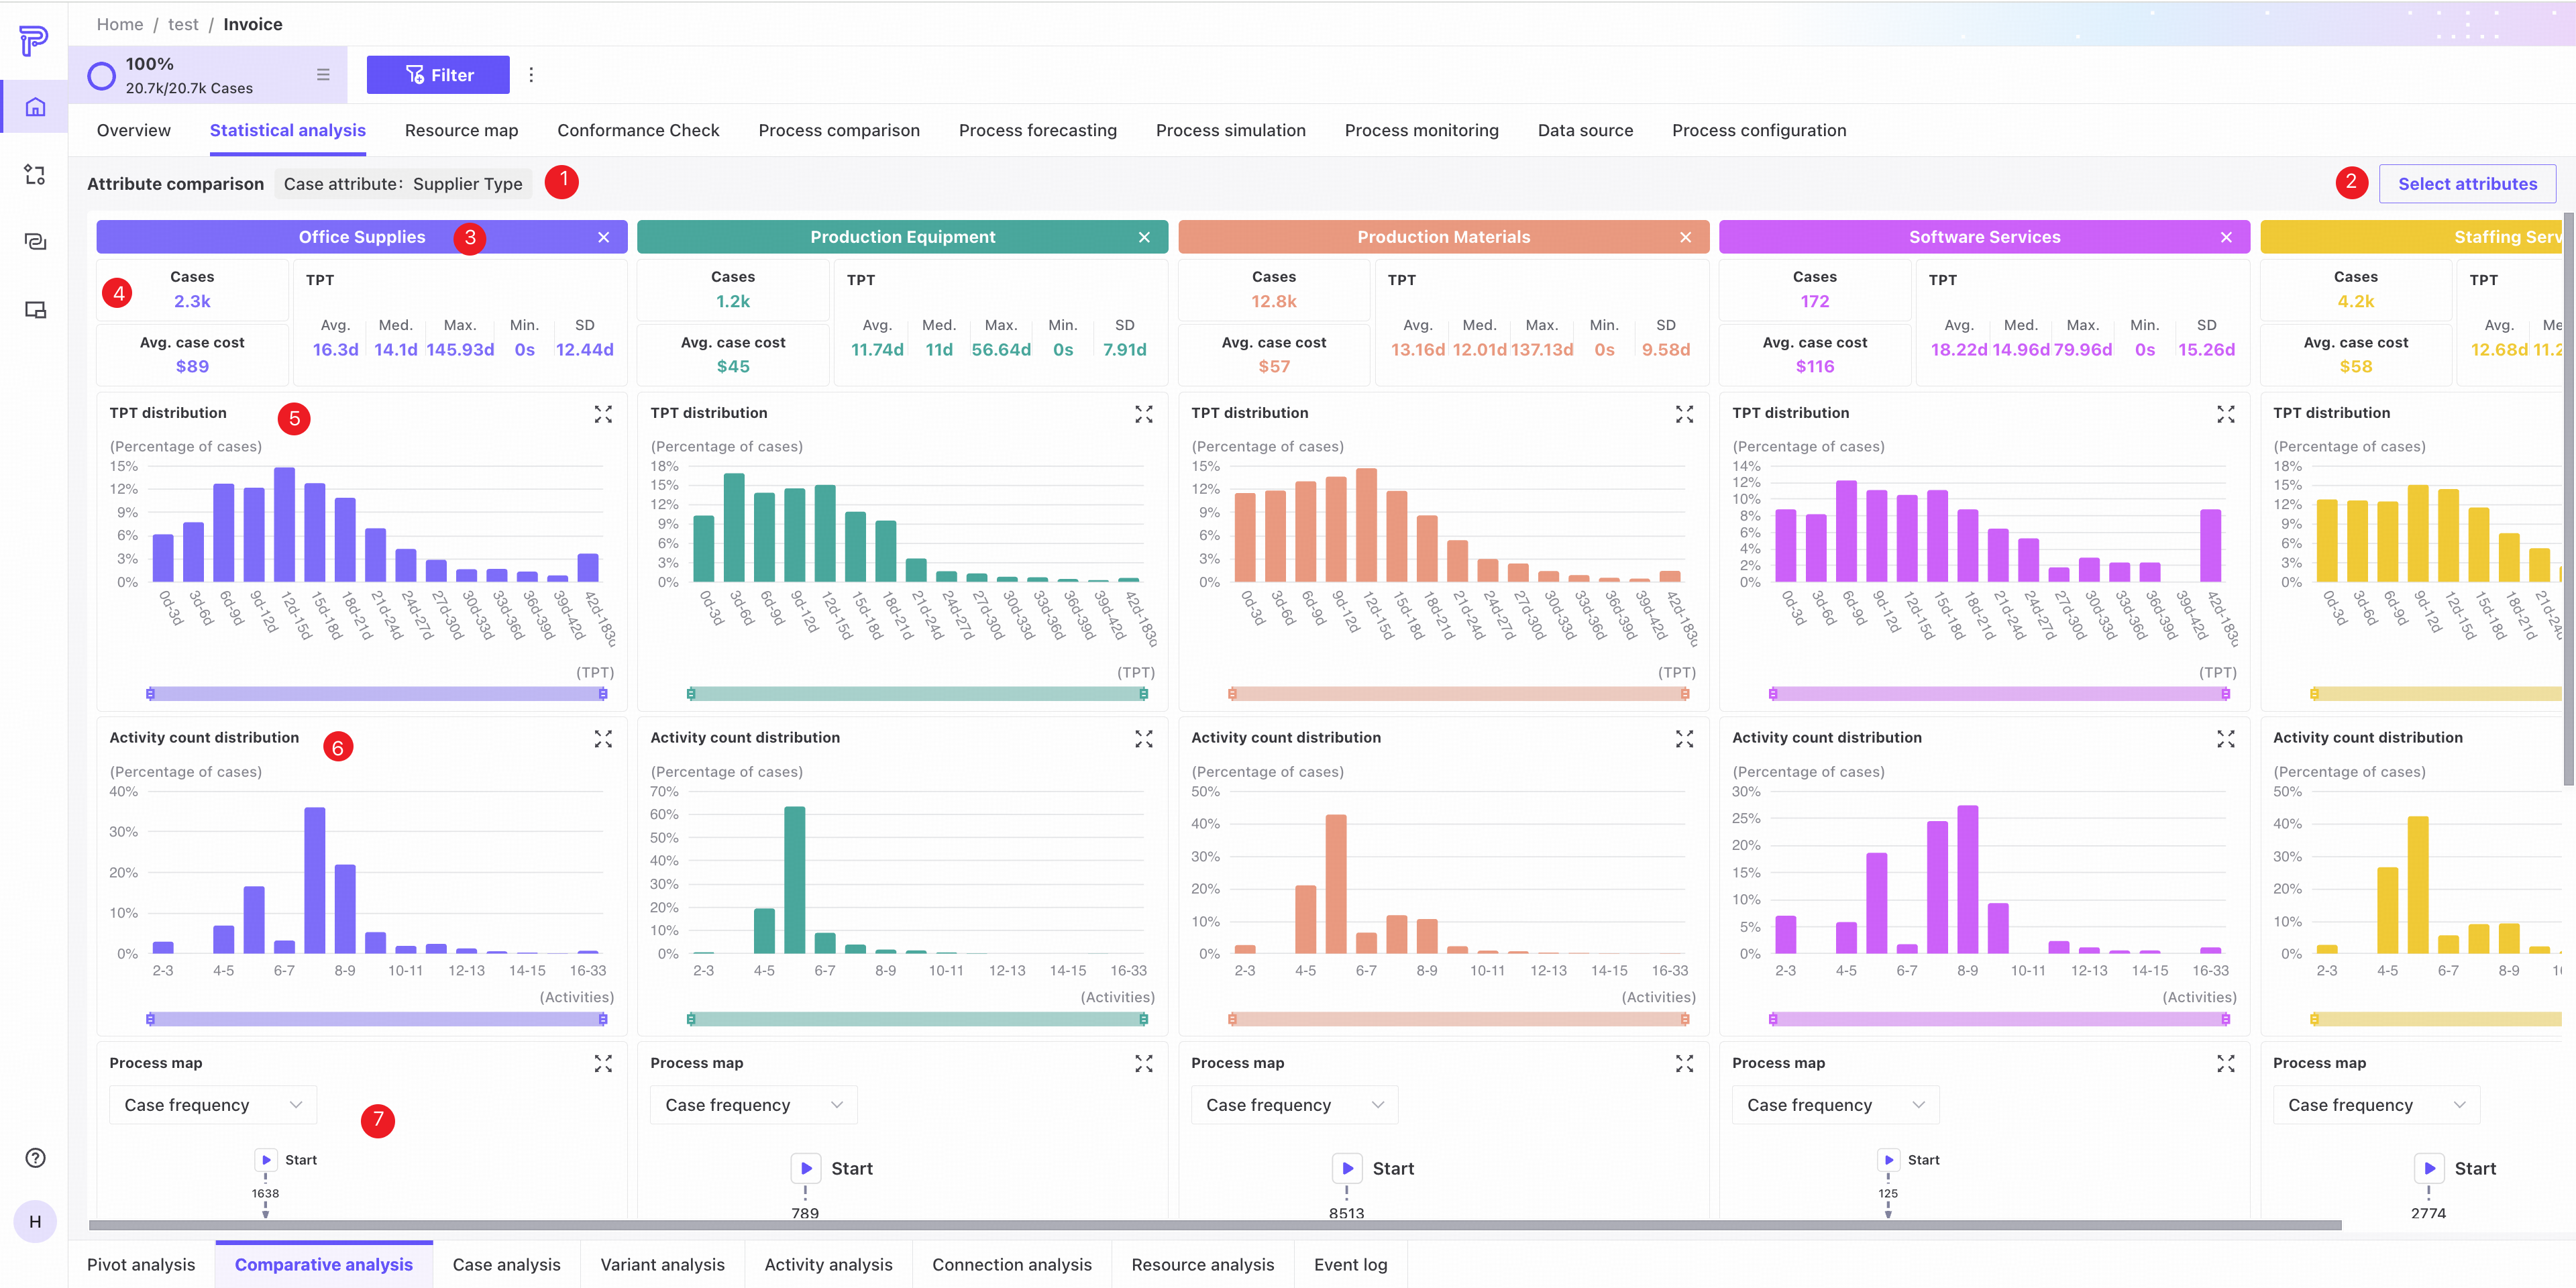
❶ Currently selected attribute column.
❷ Open attribute selection to change the attribute or selected values.
❸ The attribute value represented by this area. Click Close to deselect it quickly.
❹ Related measures.
❺ Throughput time distribution chart.
❻ Activity count distribution chart.
❼ Process map.
Event attributes
❶ Currently selected attribute column.
❷ Open attribute selection to change the attribute or selected values.
❸ The attribute value represented by this area. Click Close to deselect it quickly.
❹ Related measures.
❺ Activity frequency and throughput time statistics.
❻ Event throughput time distribution chart.
❼ Event count trend chart.
Attribute selection
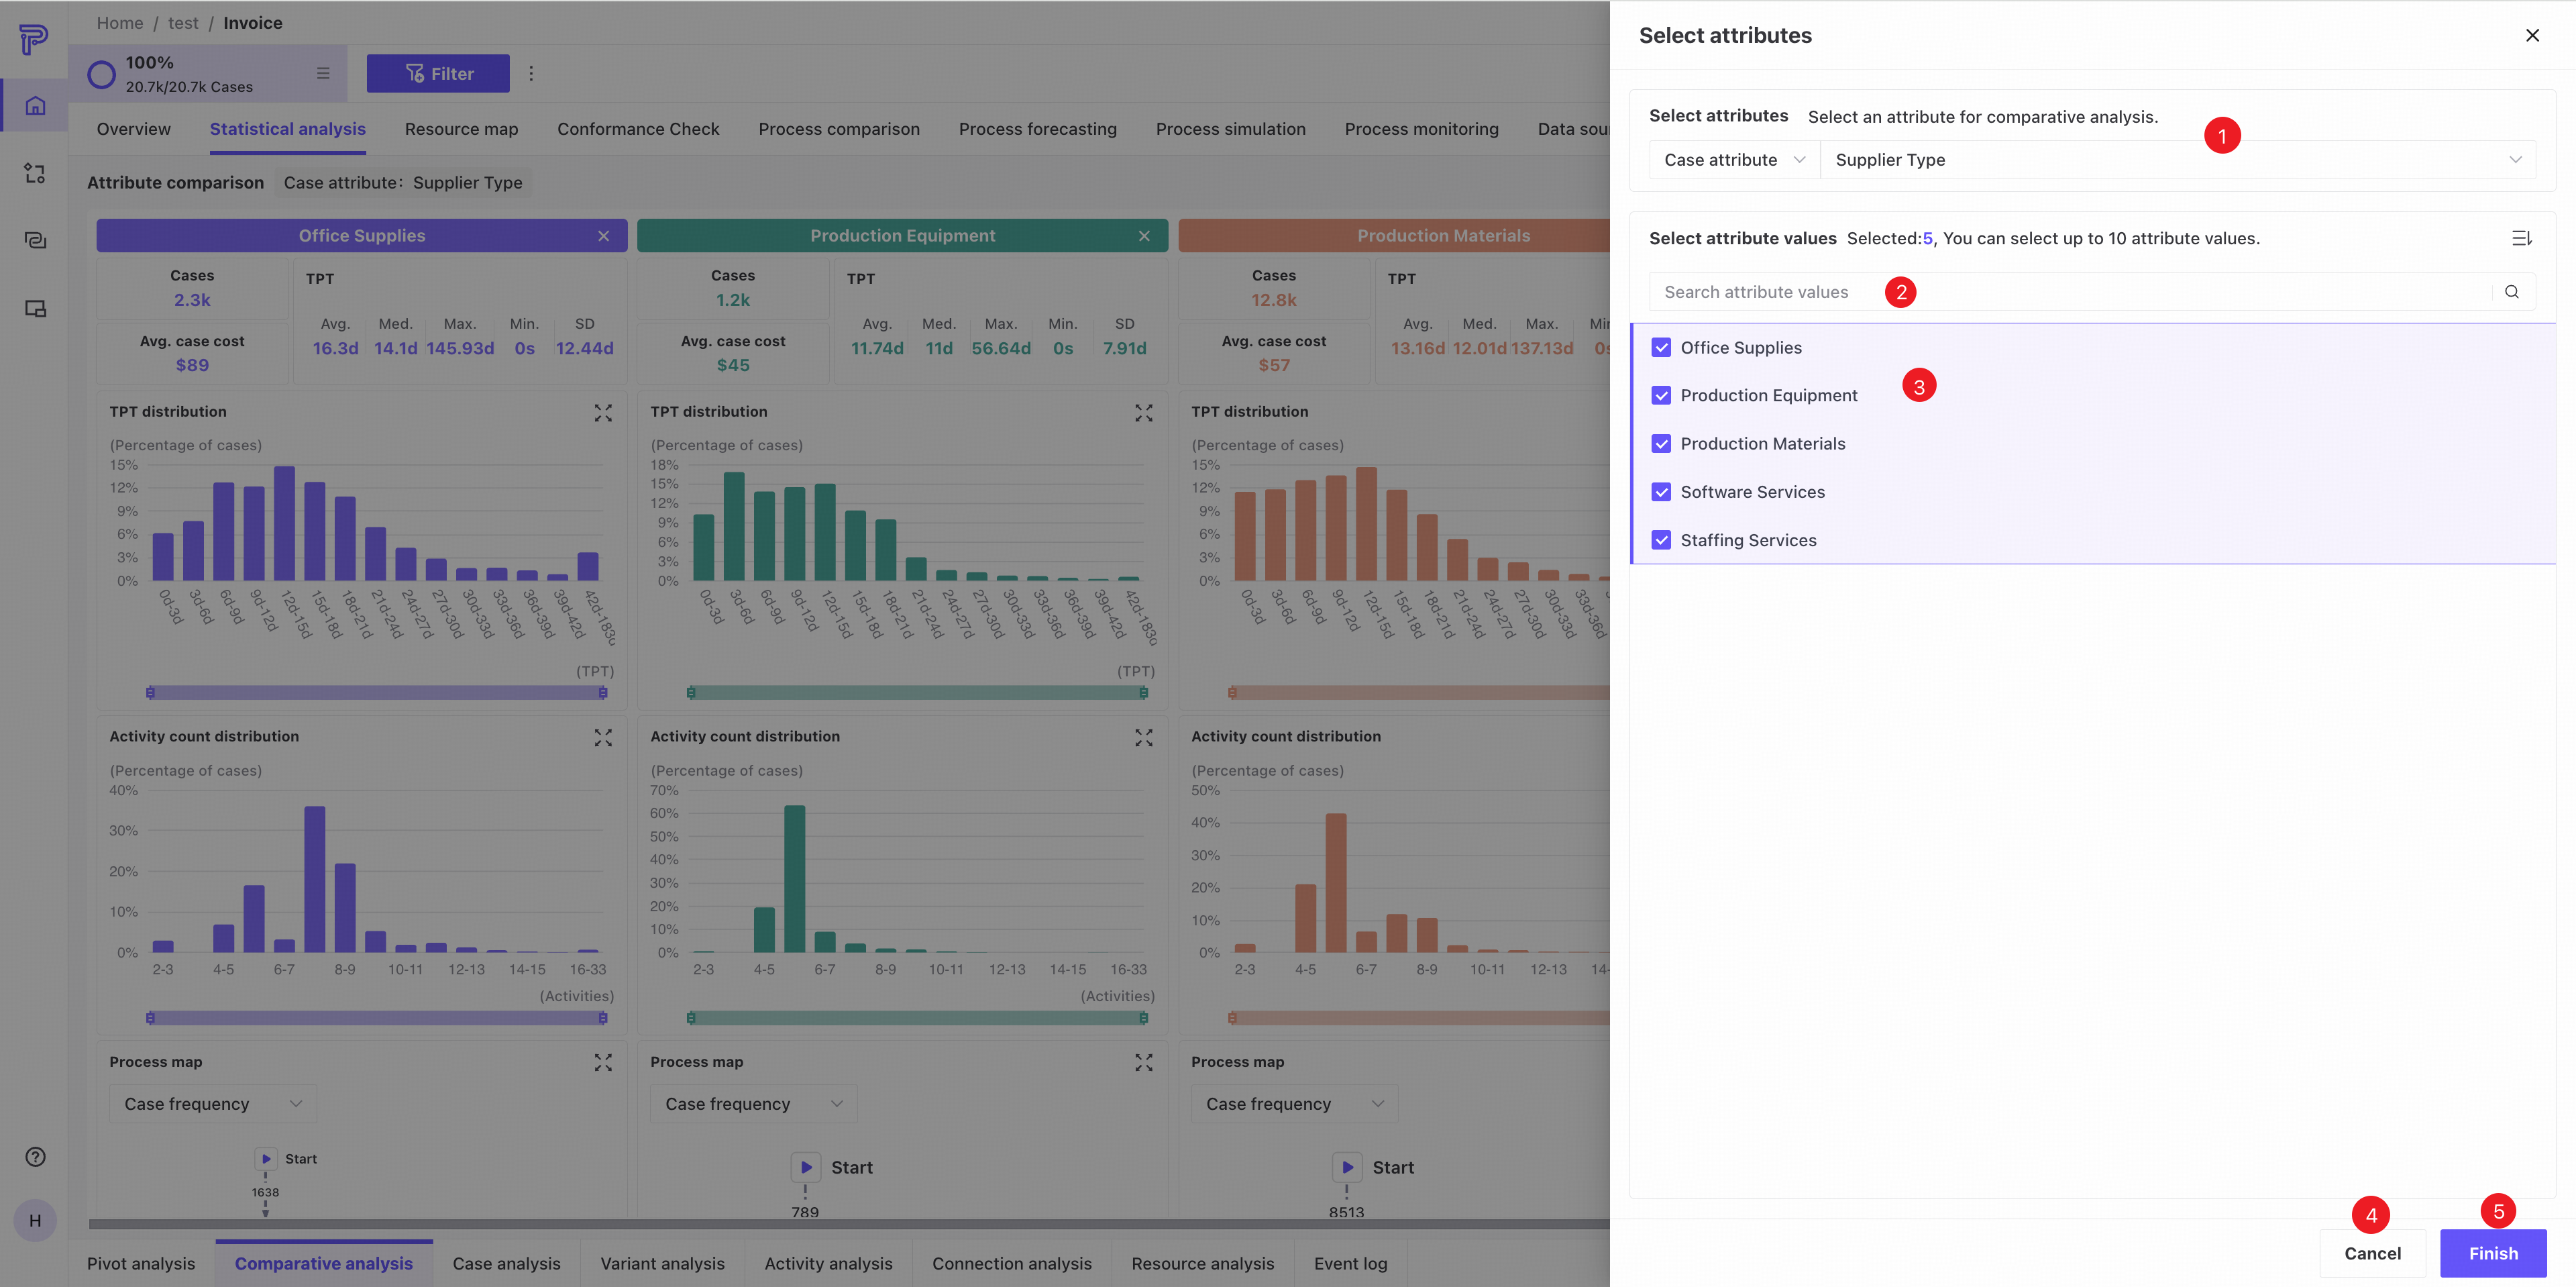
❶ Select an attribute column by category, including custom and related attributes.
❷ Search attribute values.
❸ Select checkboxes for the values to compare. You can select up to 10.
❹ Click Cancel to close the page.
❺ Click Finish to save your selections.
Case analysis
Case analysis examines data at the case level and provides chart and list views.
Chart view
Use the tabs in the upper-right corner to switch to chart view.
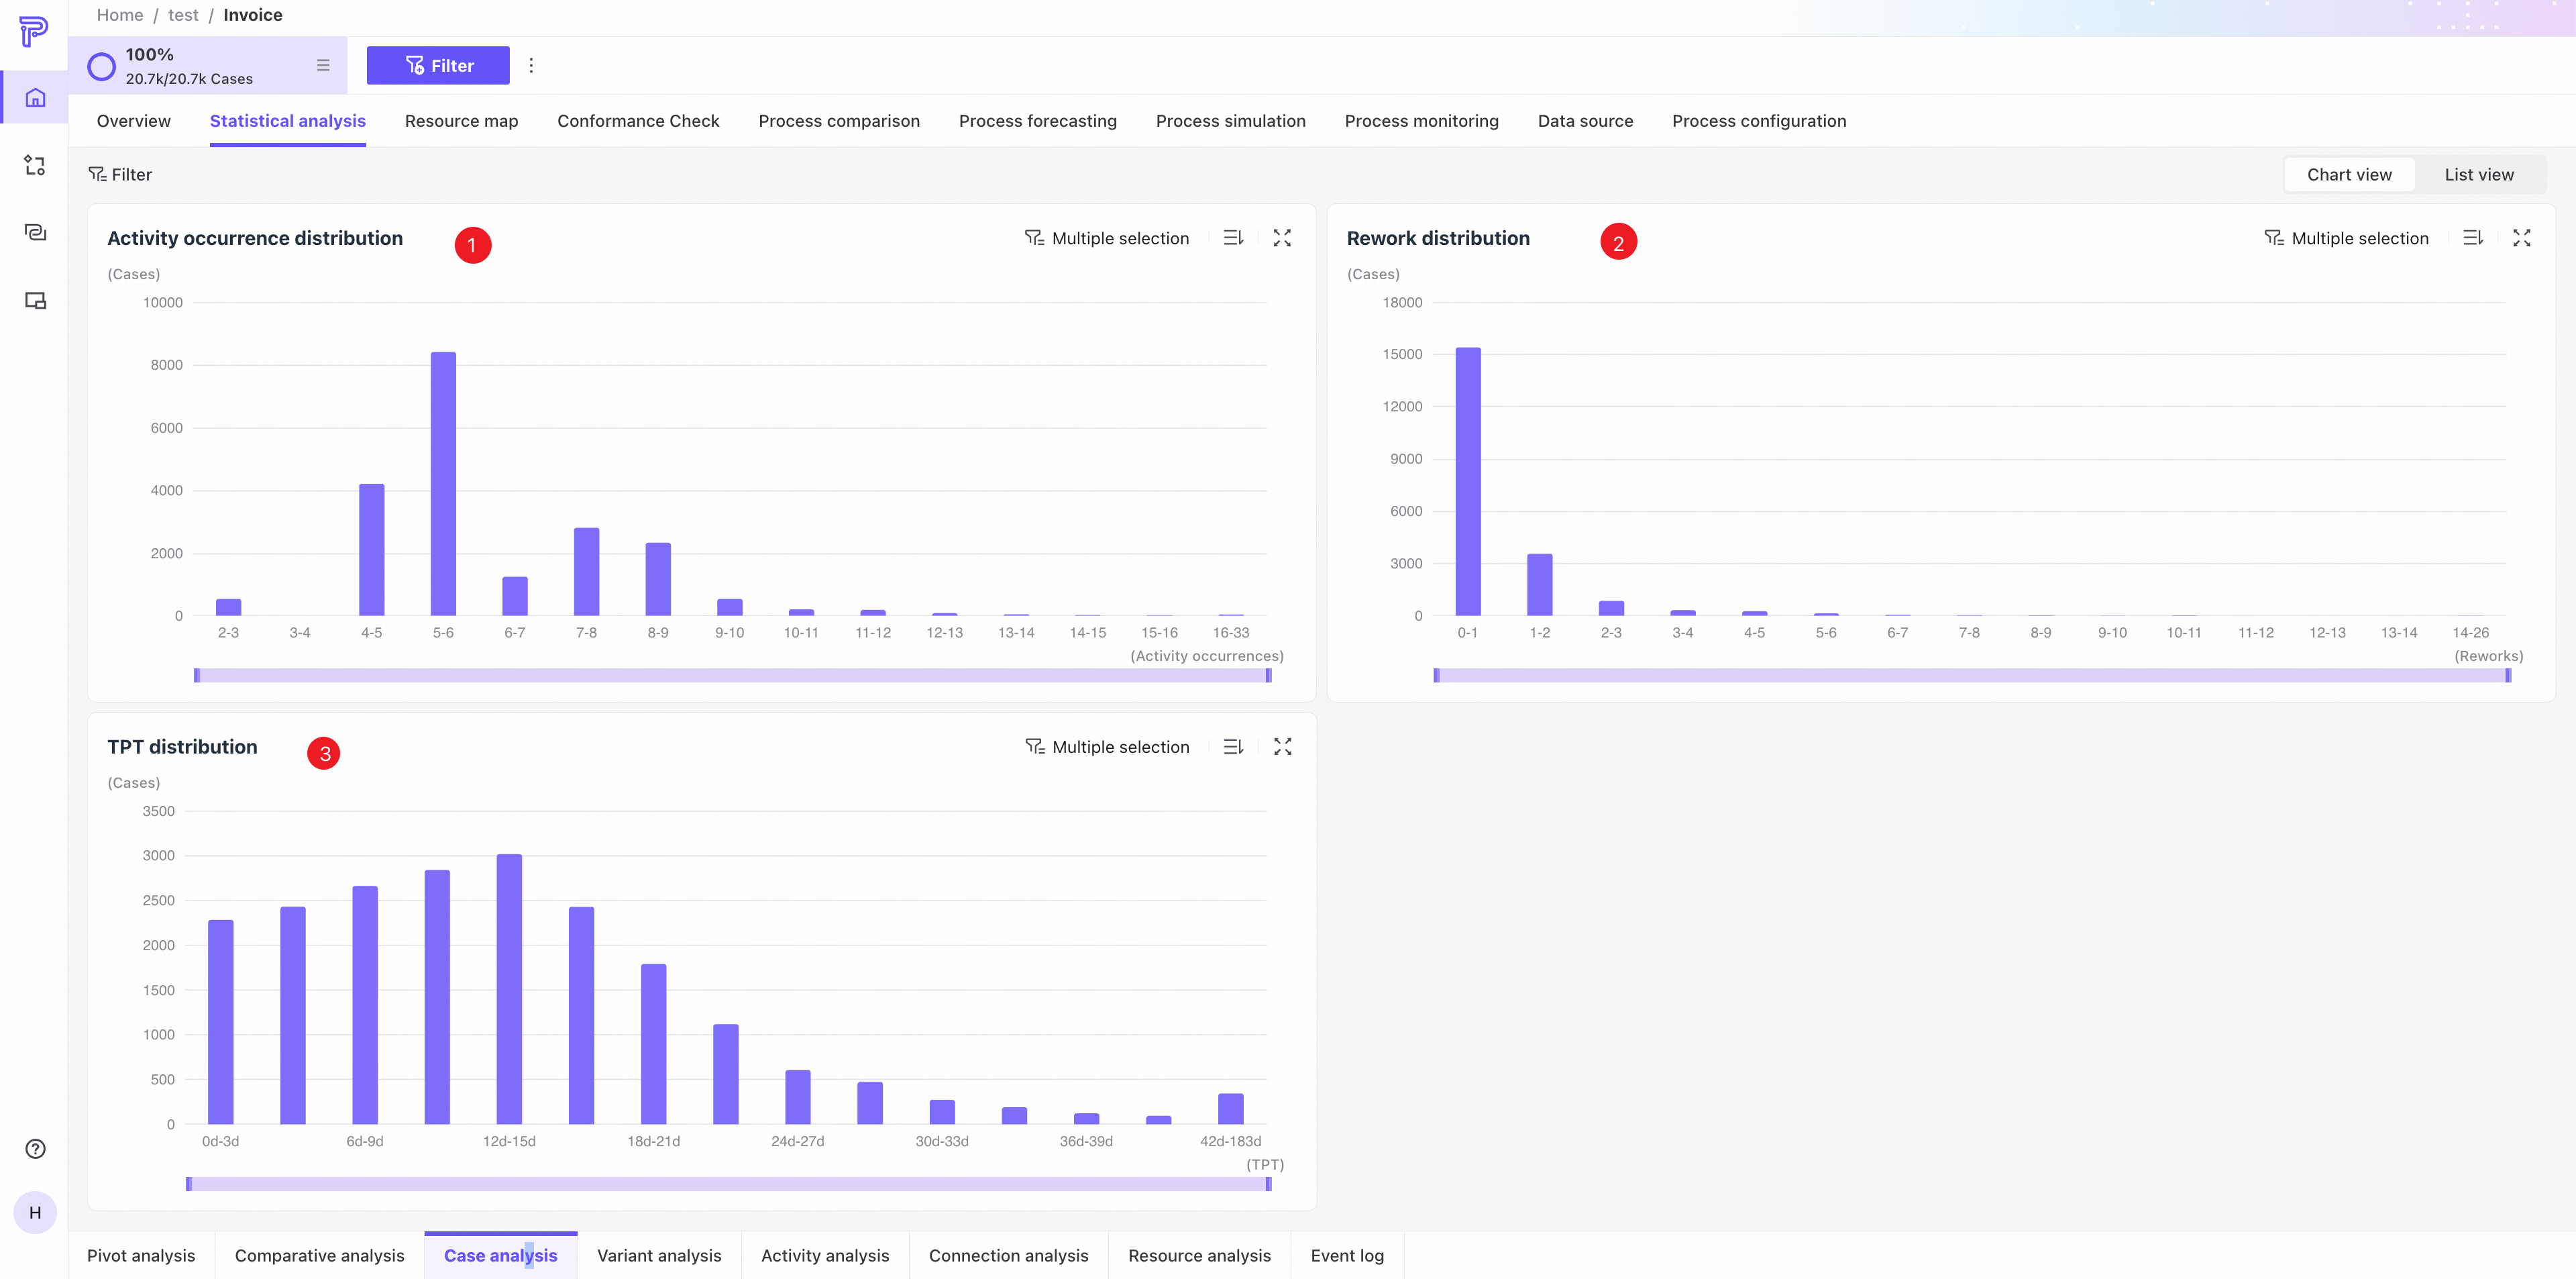
❶ Activity frequency distribution: case counts by activity frequency range. Use the controls in the upper-right corner to sort or display the chart in full screen.
❷ Rework distribution: case counts by rework count range. Use the controls in the upper-right corner to sort or display the chart in full screen.
❸ Throughput time distribution: case counts by throughput time range. Use the controls in the upper-right corner to sort or display the chart in full screen.
List view
Use the tabs in the upper-right corner to switch to list view.
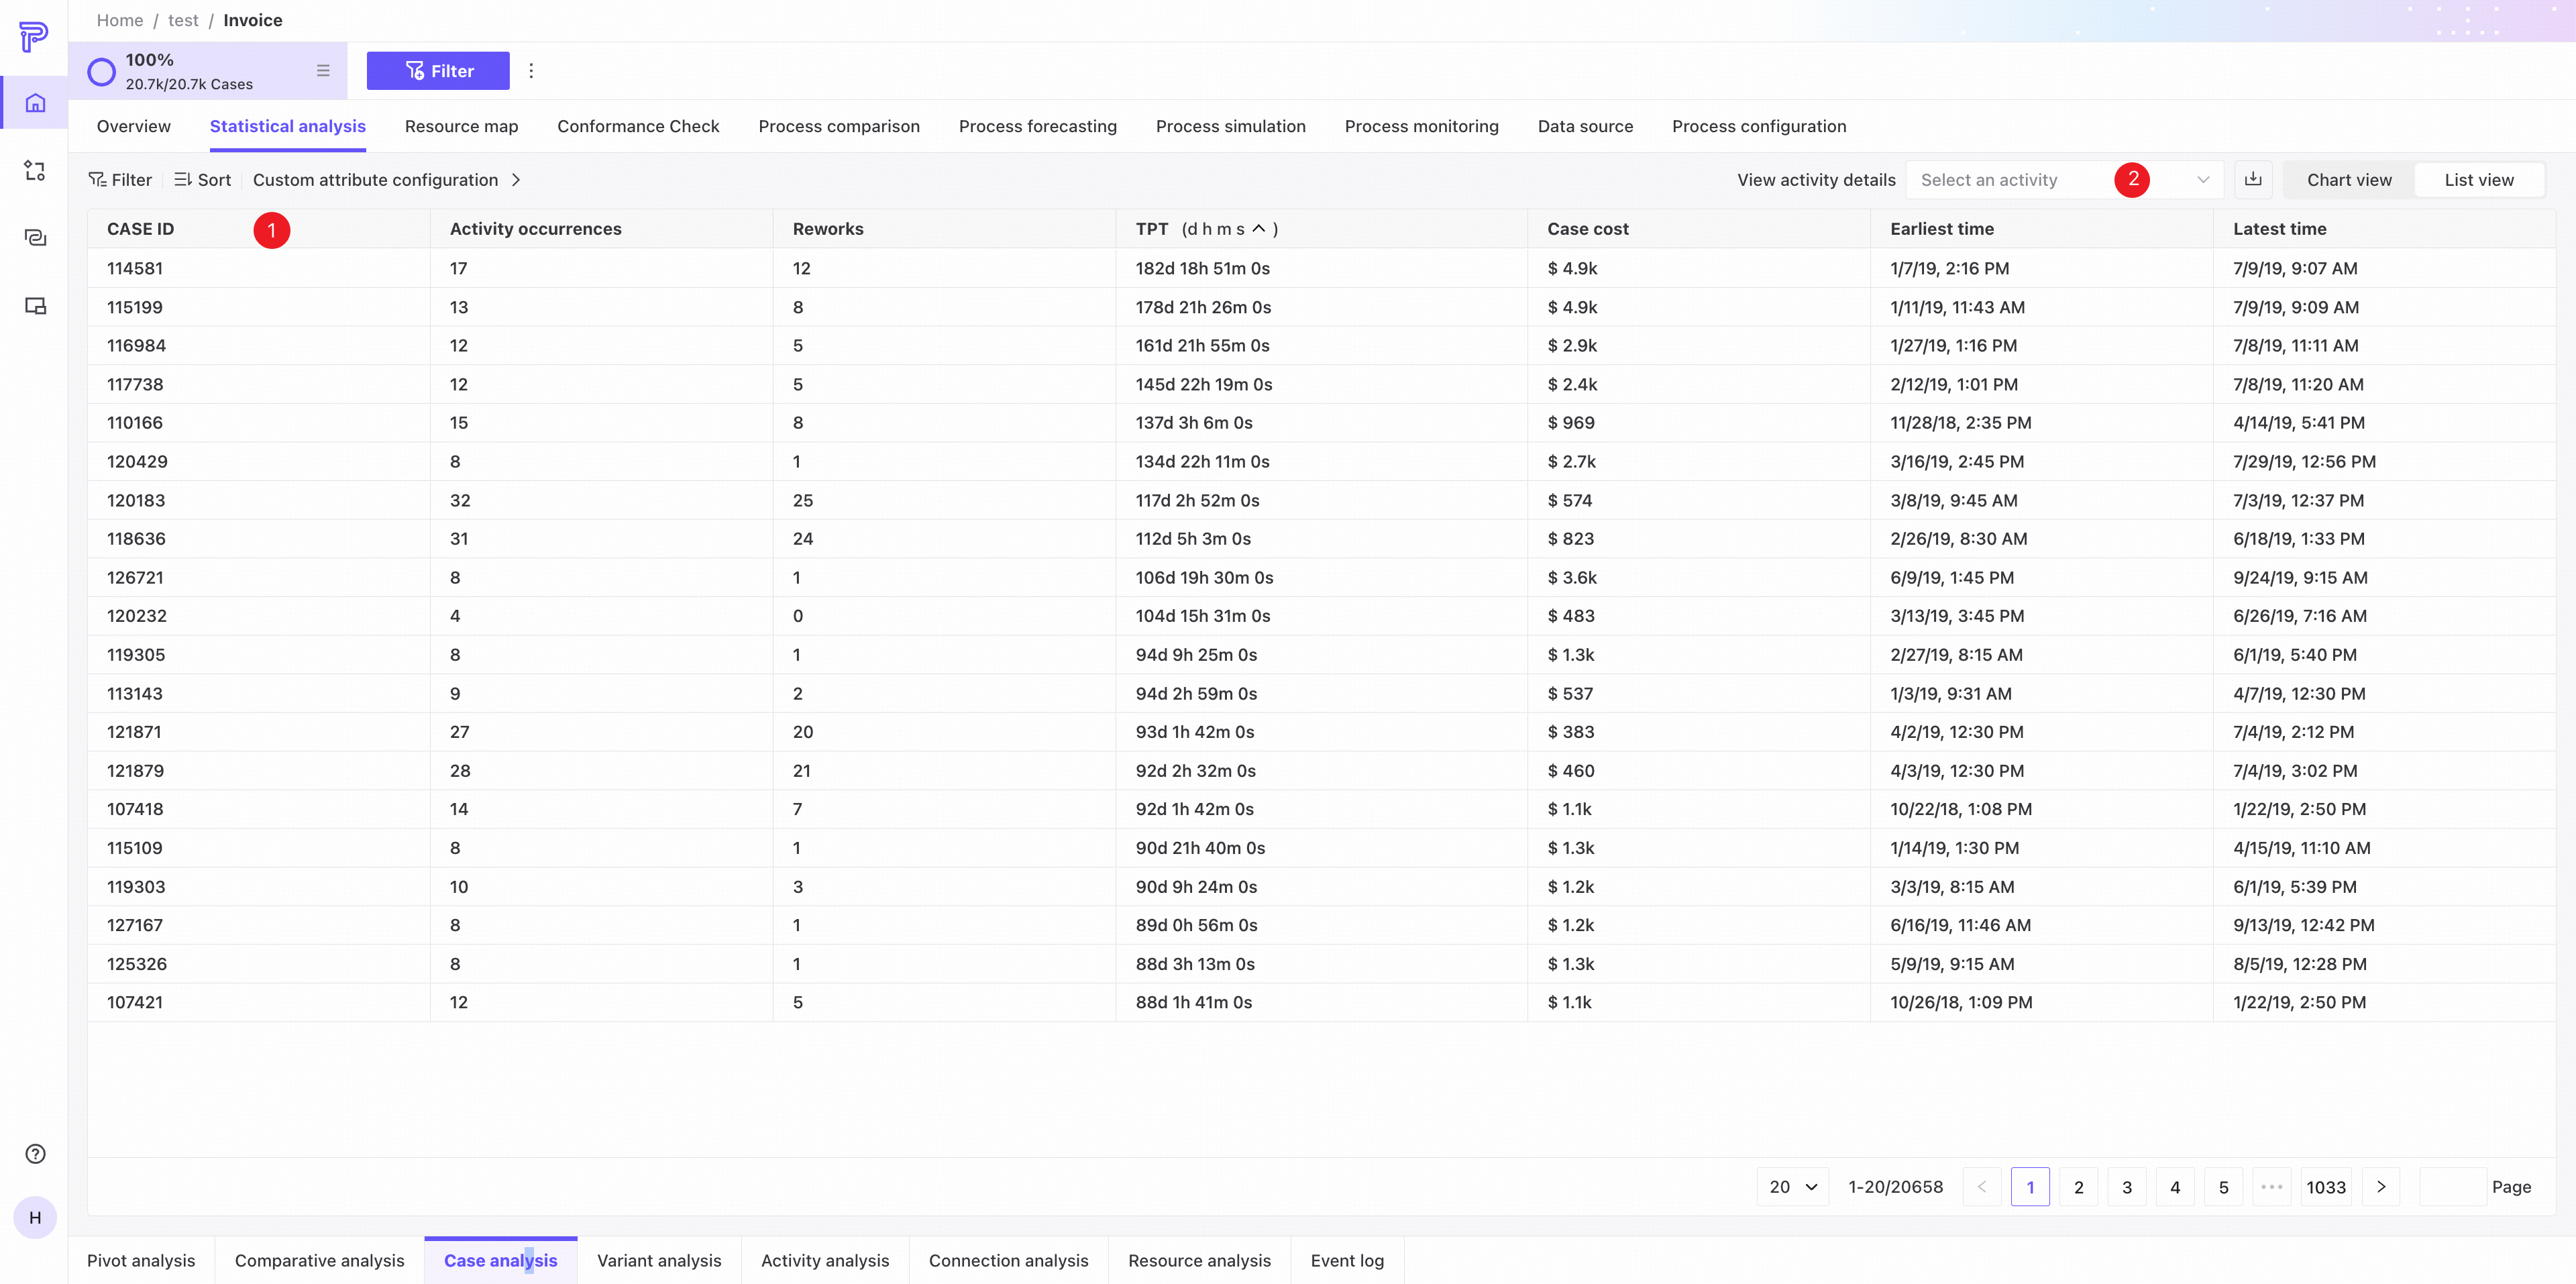
❶ The list shows Case ID, activity count, rework count, throughput time, earliest occurrence, and latest occurrence for every case in the current process.
❷ Select an activity to see its details. Three columns are added: frequency, rework count, and throughput time for the selected activity.
Variant analysis
Variant analysis examines data at the variant level and provides chart and list views.
Chart view
Use the tabs in the upper-right corner to switch to chart view.
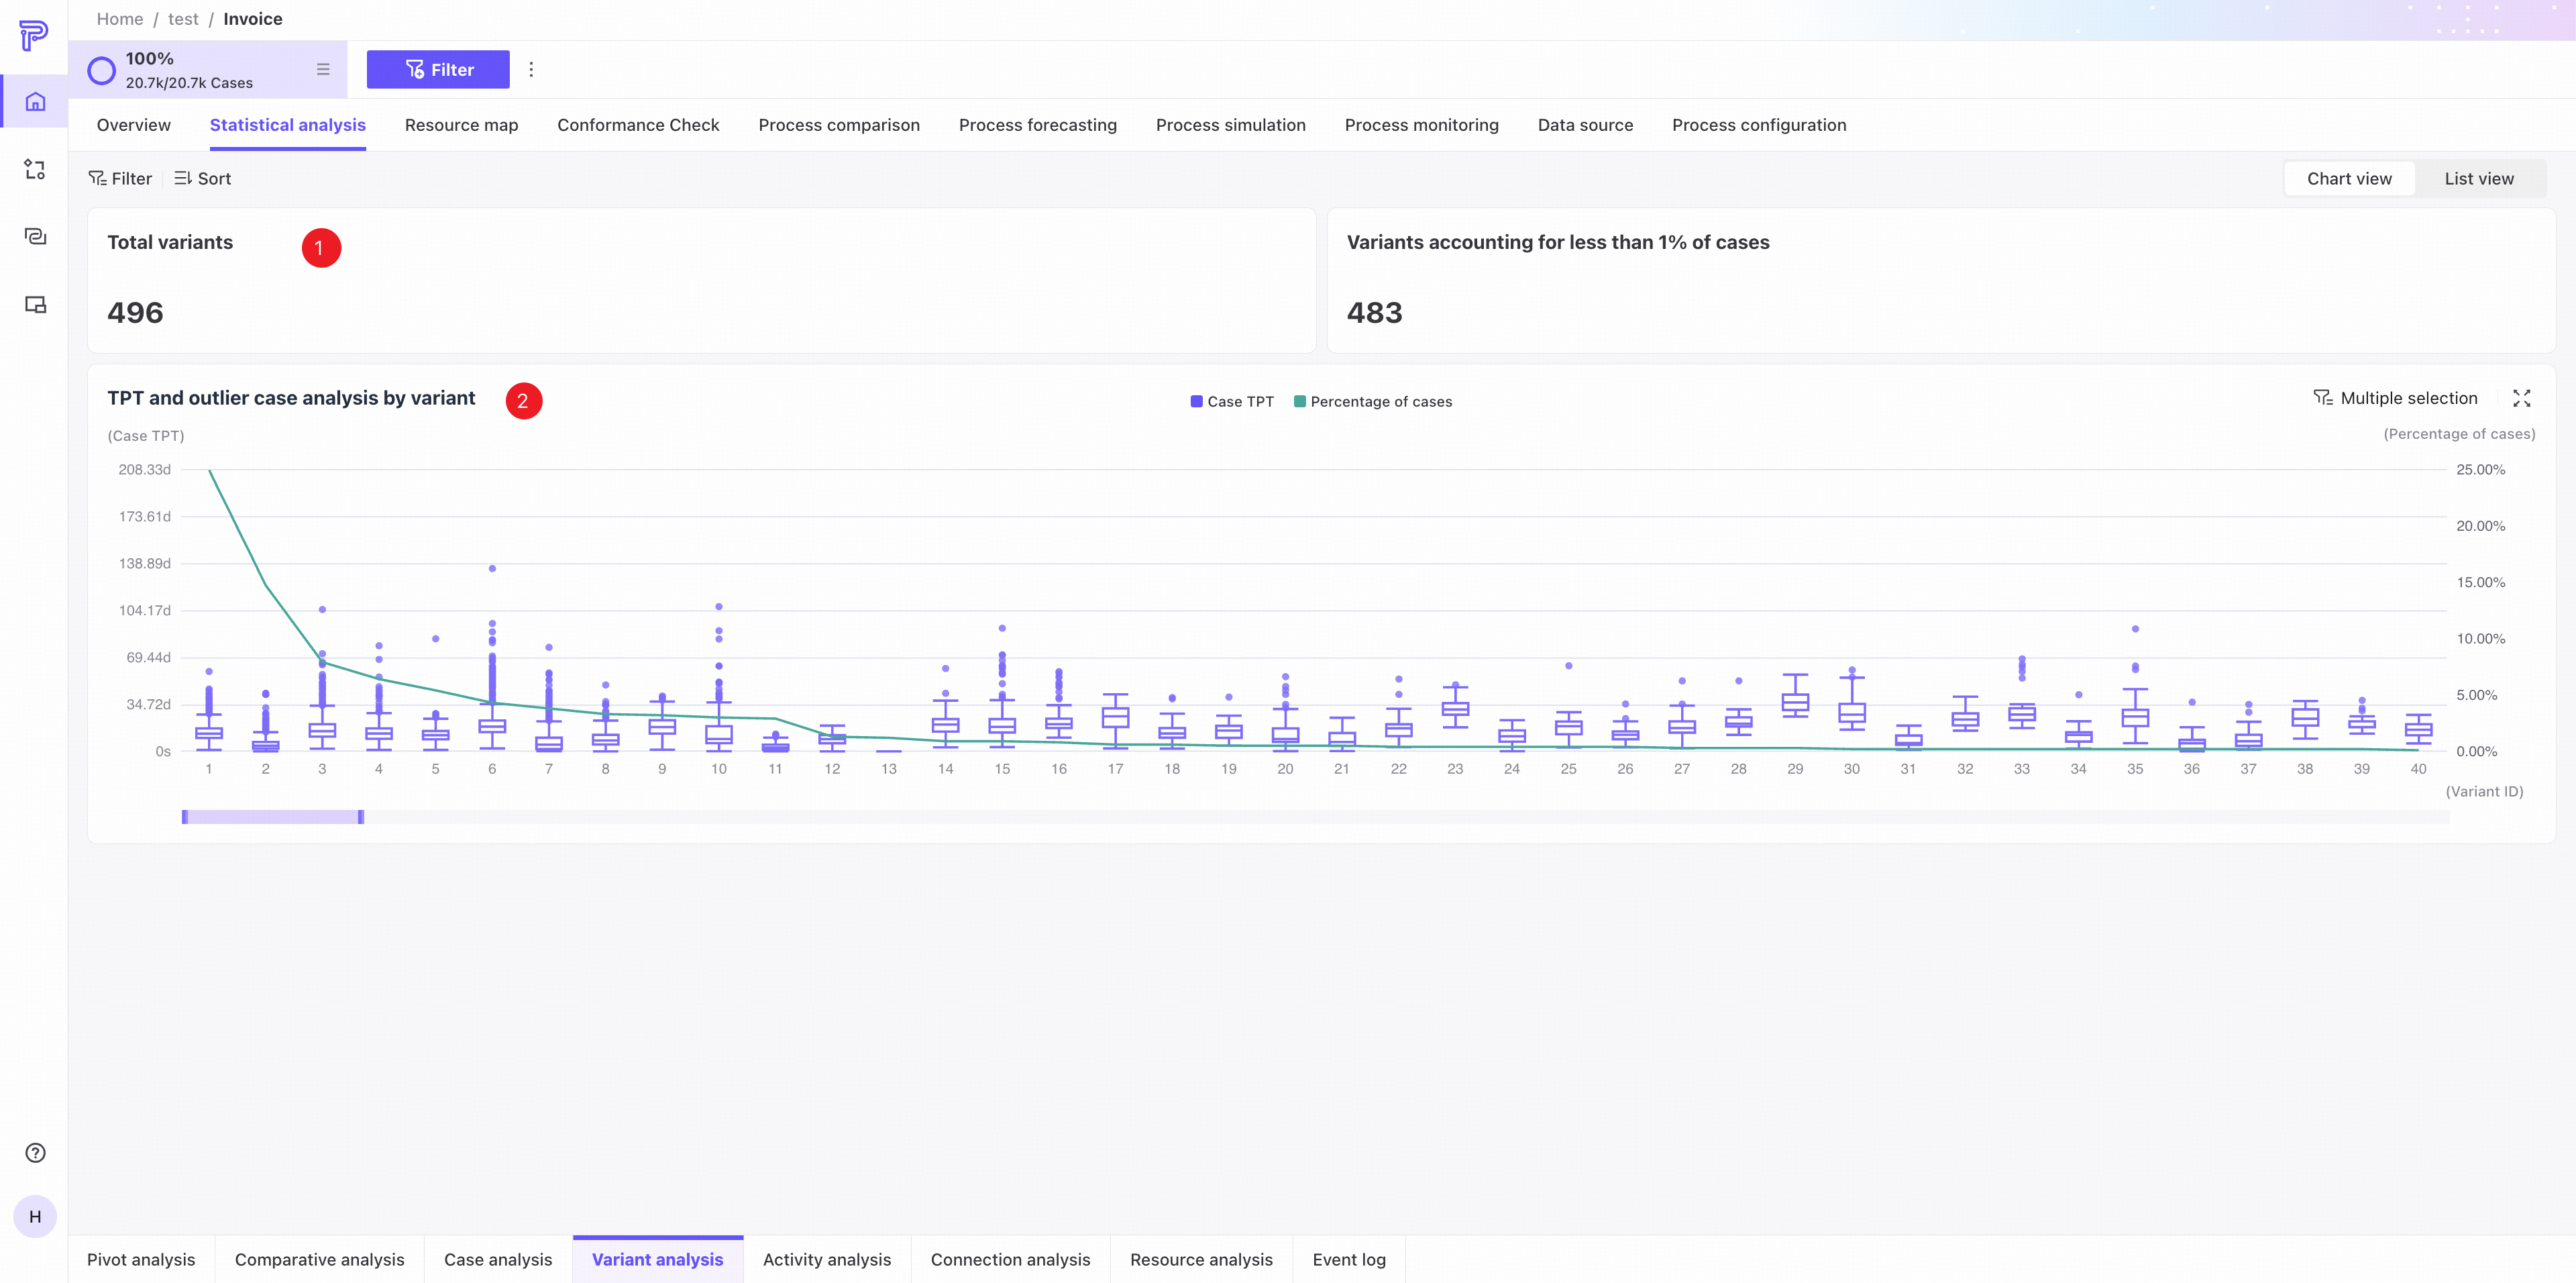
❶ KPI area: total variants and the number of variants accounting for less than 1% of cases.
❷ Variant throughput time distribution and outlier case analysis.
- The box plots show throughput time distributions by variant. Hover to see details for a variant.
- Hover over an outlier to see case information. Click View case details in the Event log tab to open its details.
- The line chart shows each variant's percentage of cases.
List view
Use the tabs in the upper-right corner to switch to list view.
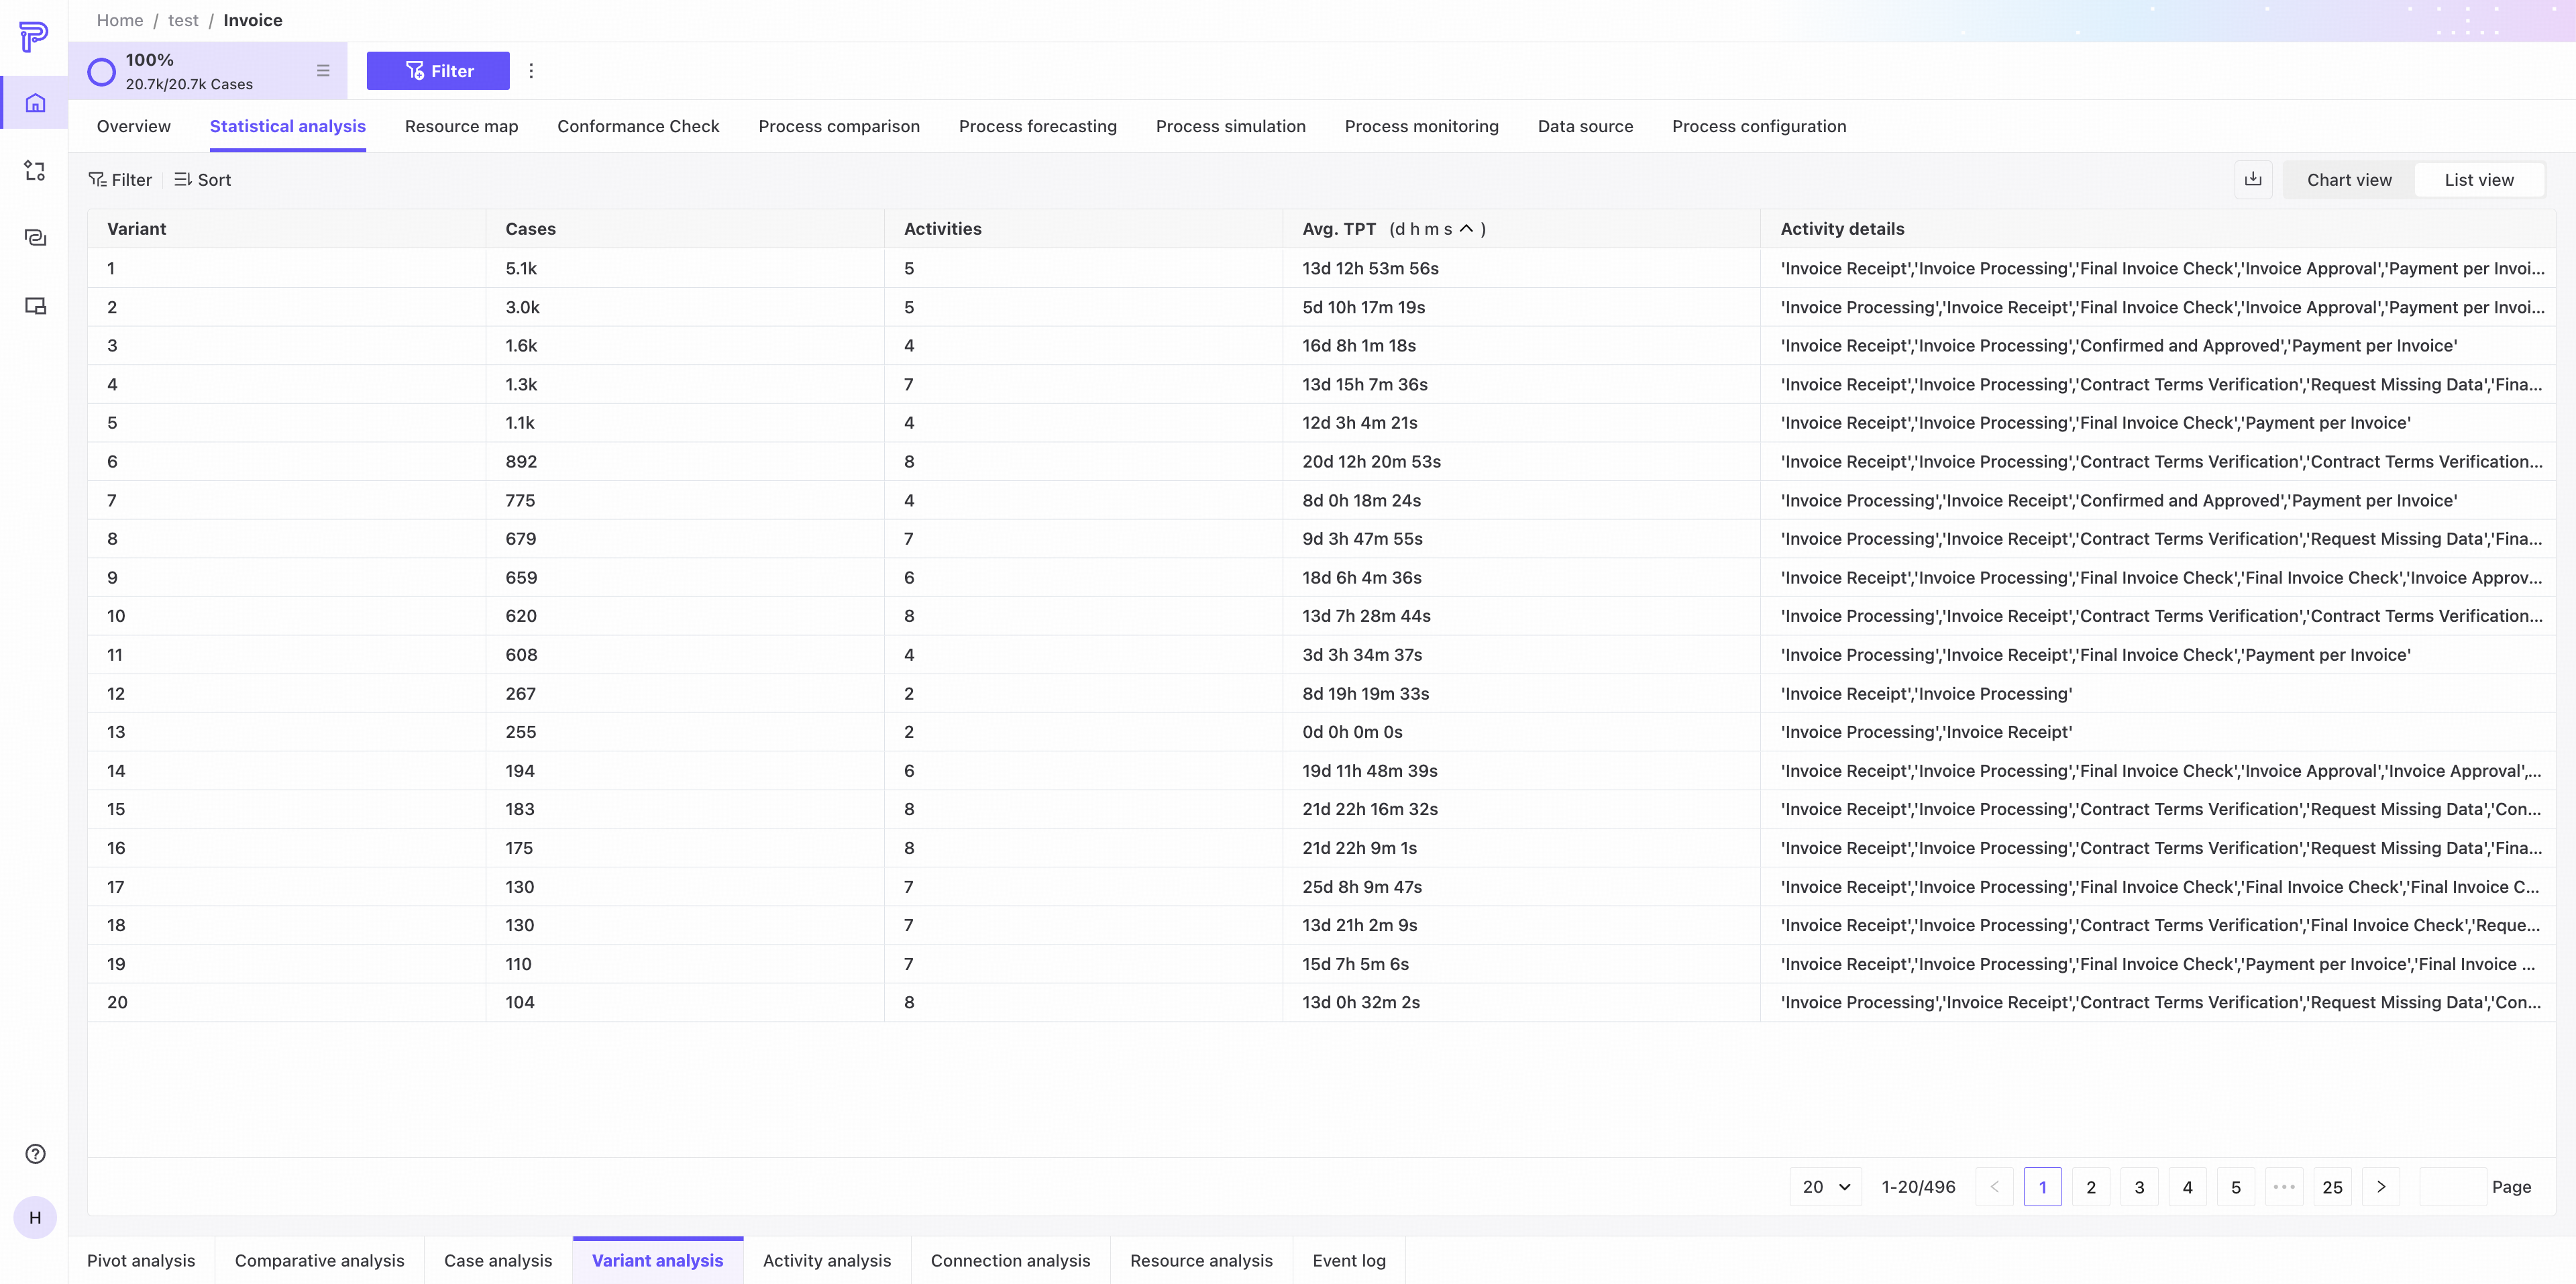
The list shows variant ID, case count, activity count, average throughput time, and activity details for every variant in the current process.
Activity analysis
Activity analysis examines data at the activity level and provides distribution, chart, and list views.
Chart view
Use the tabs in the upper-right corner to switch to chart view.
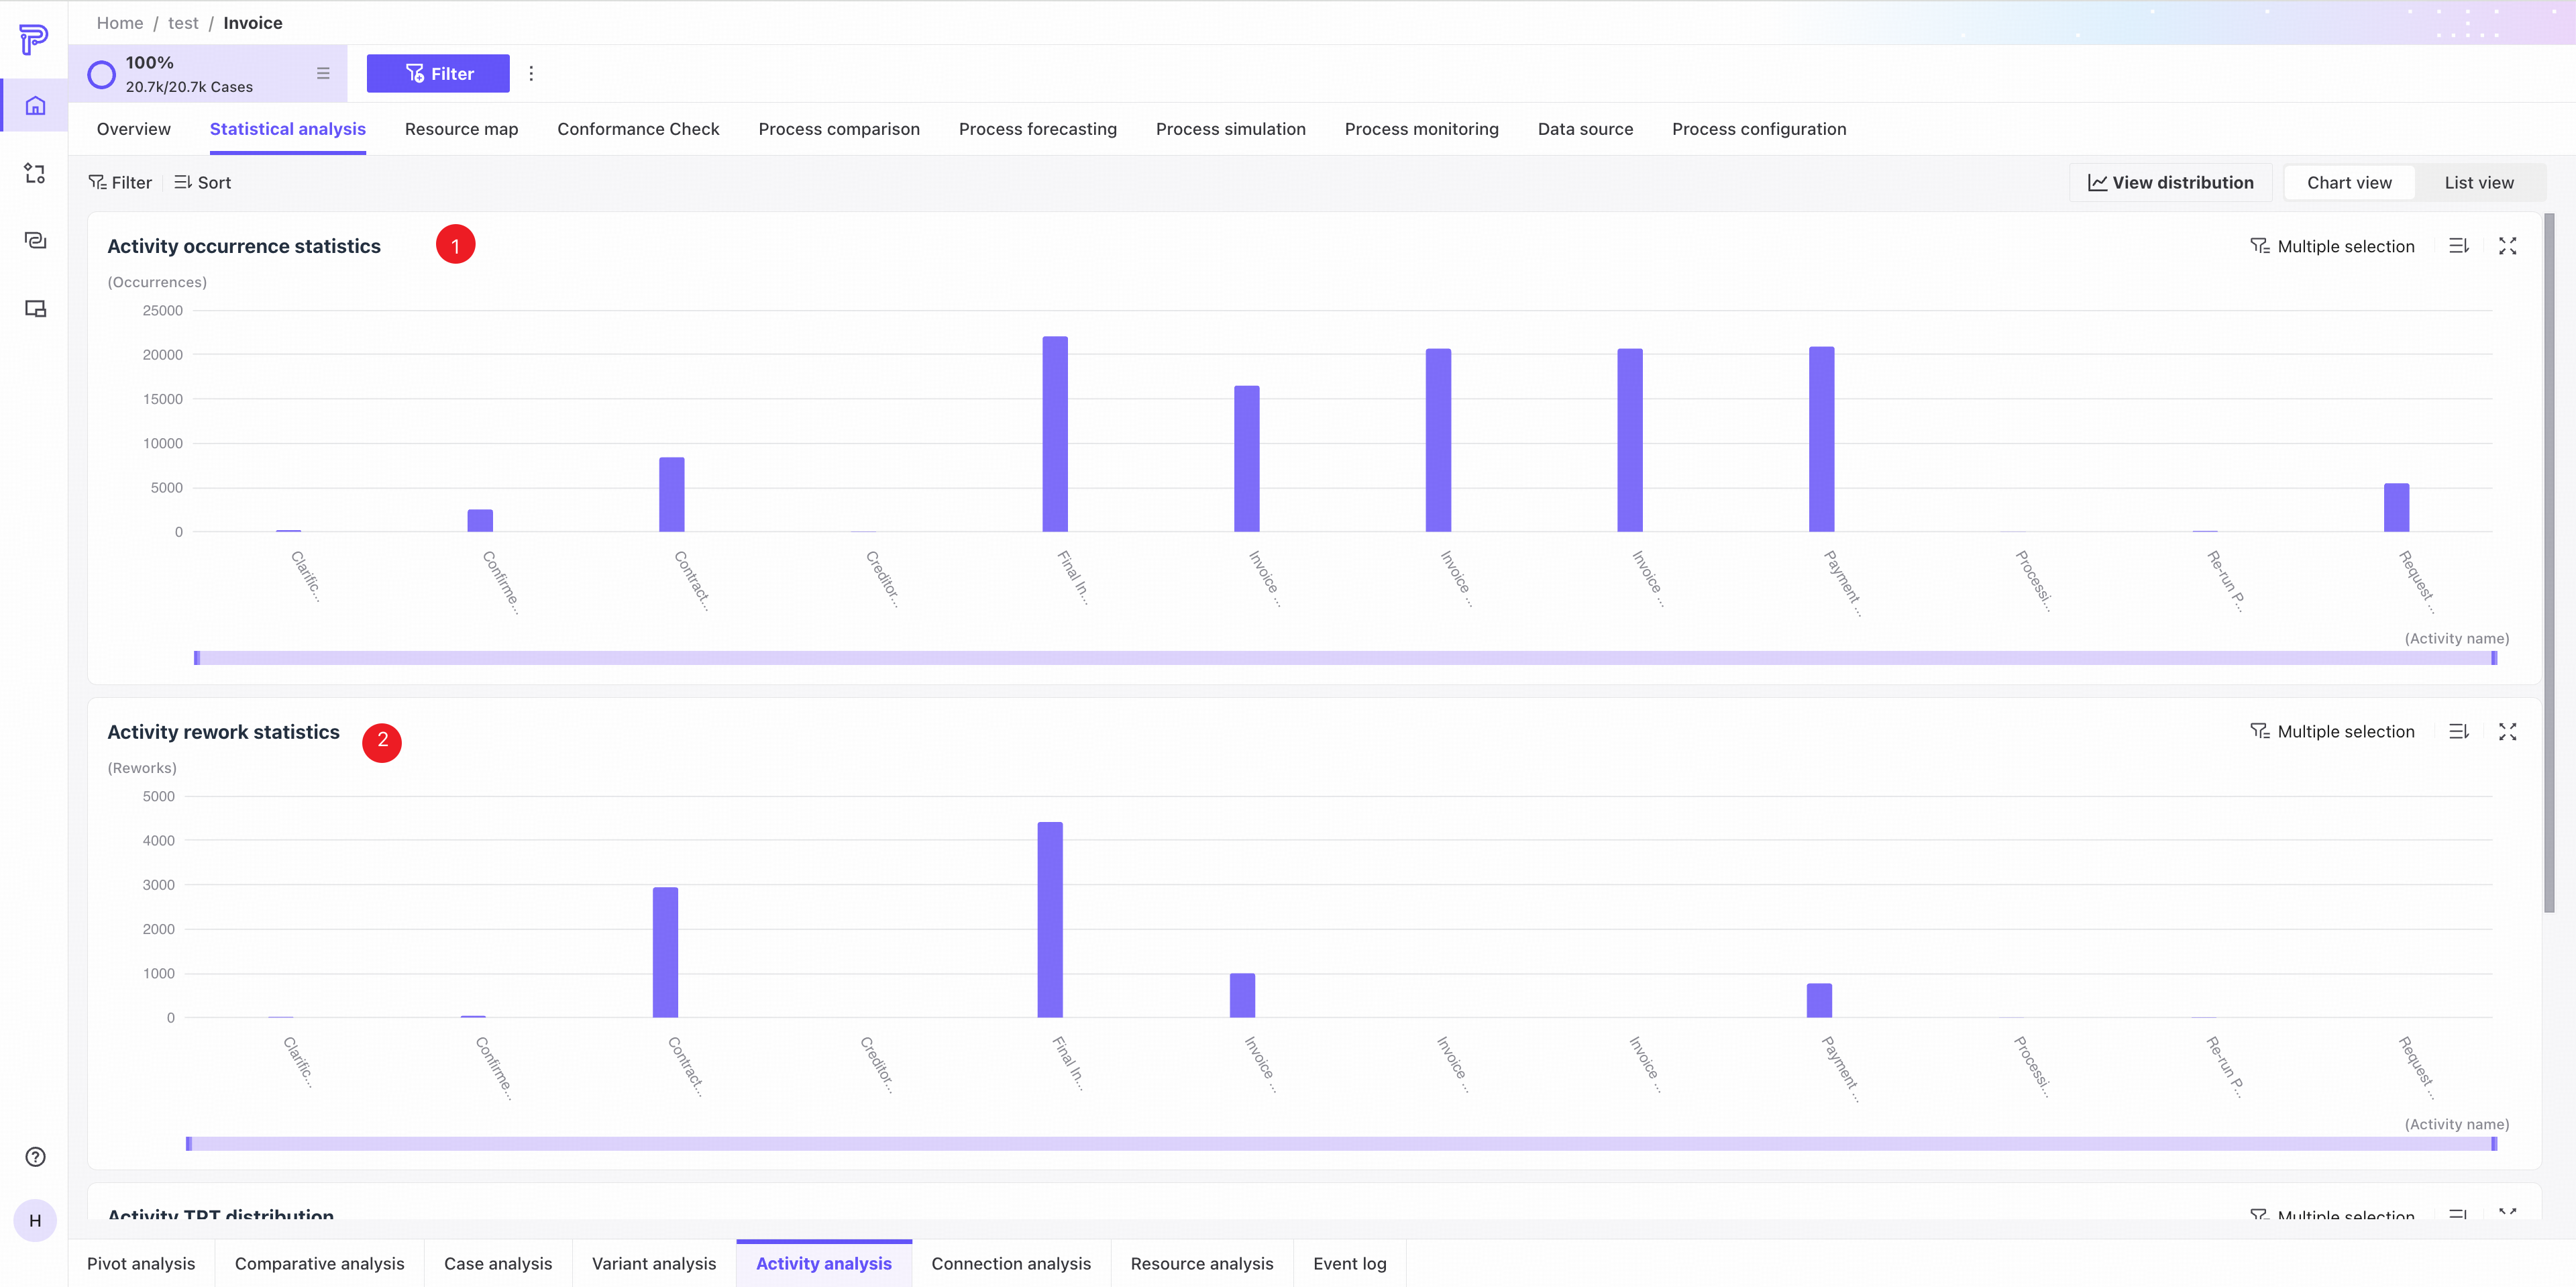
❶ Activity frequency: occurrence counts for each activity in the current process. Hover to see details.
❷ Activity rework: rework counts for each activity in the current process. Hover to see details.
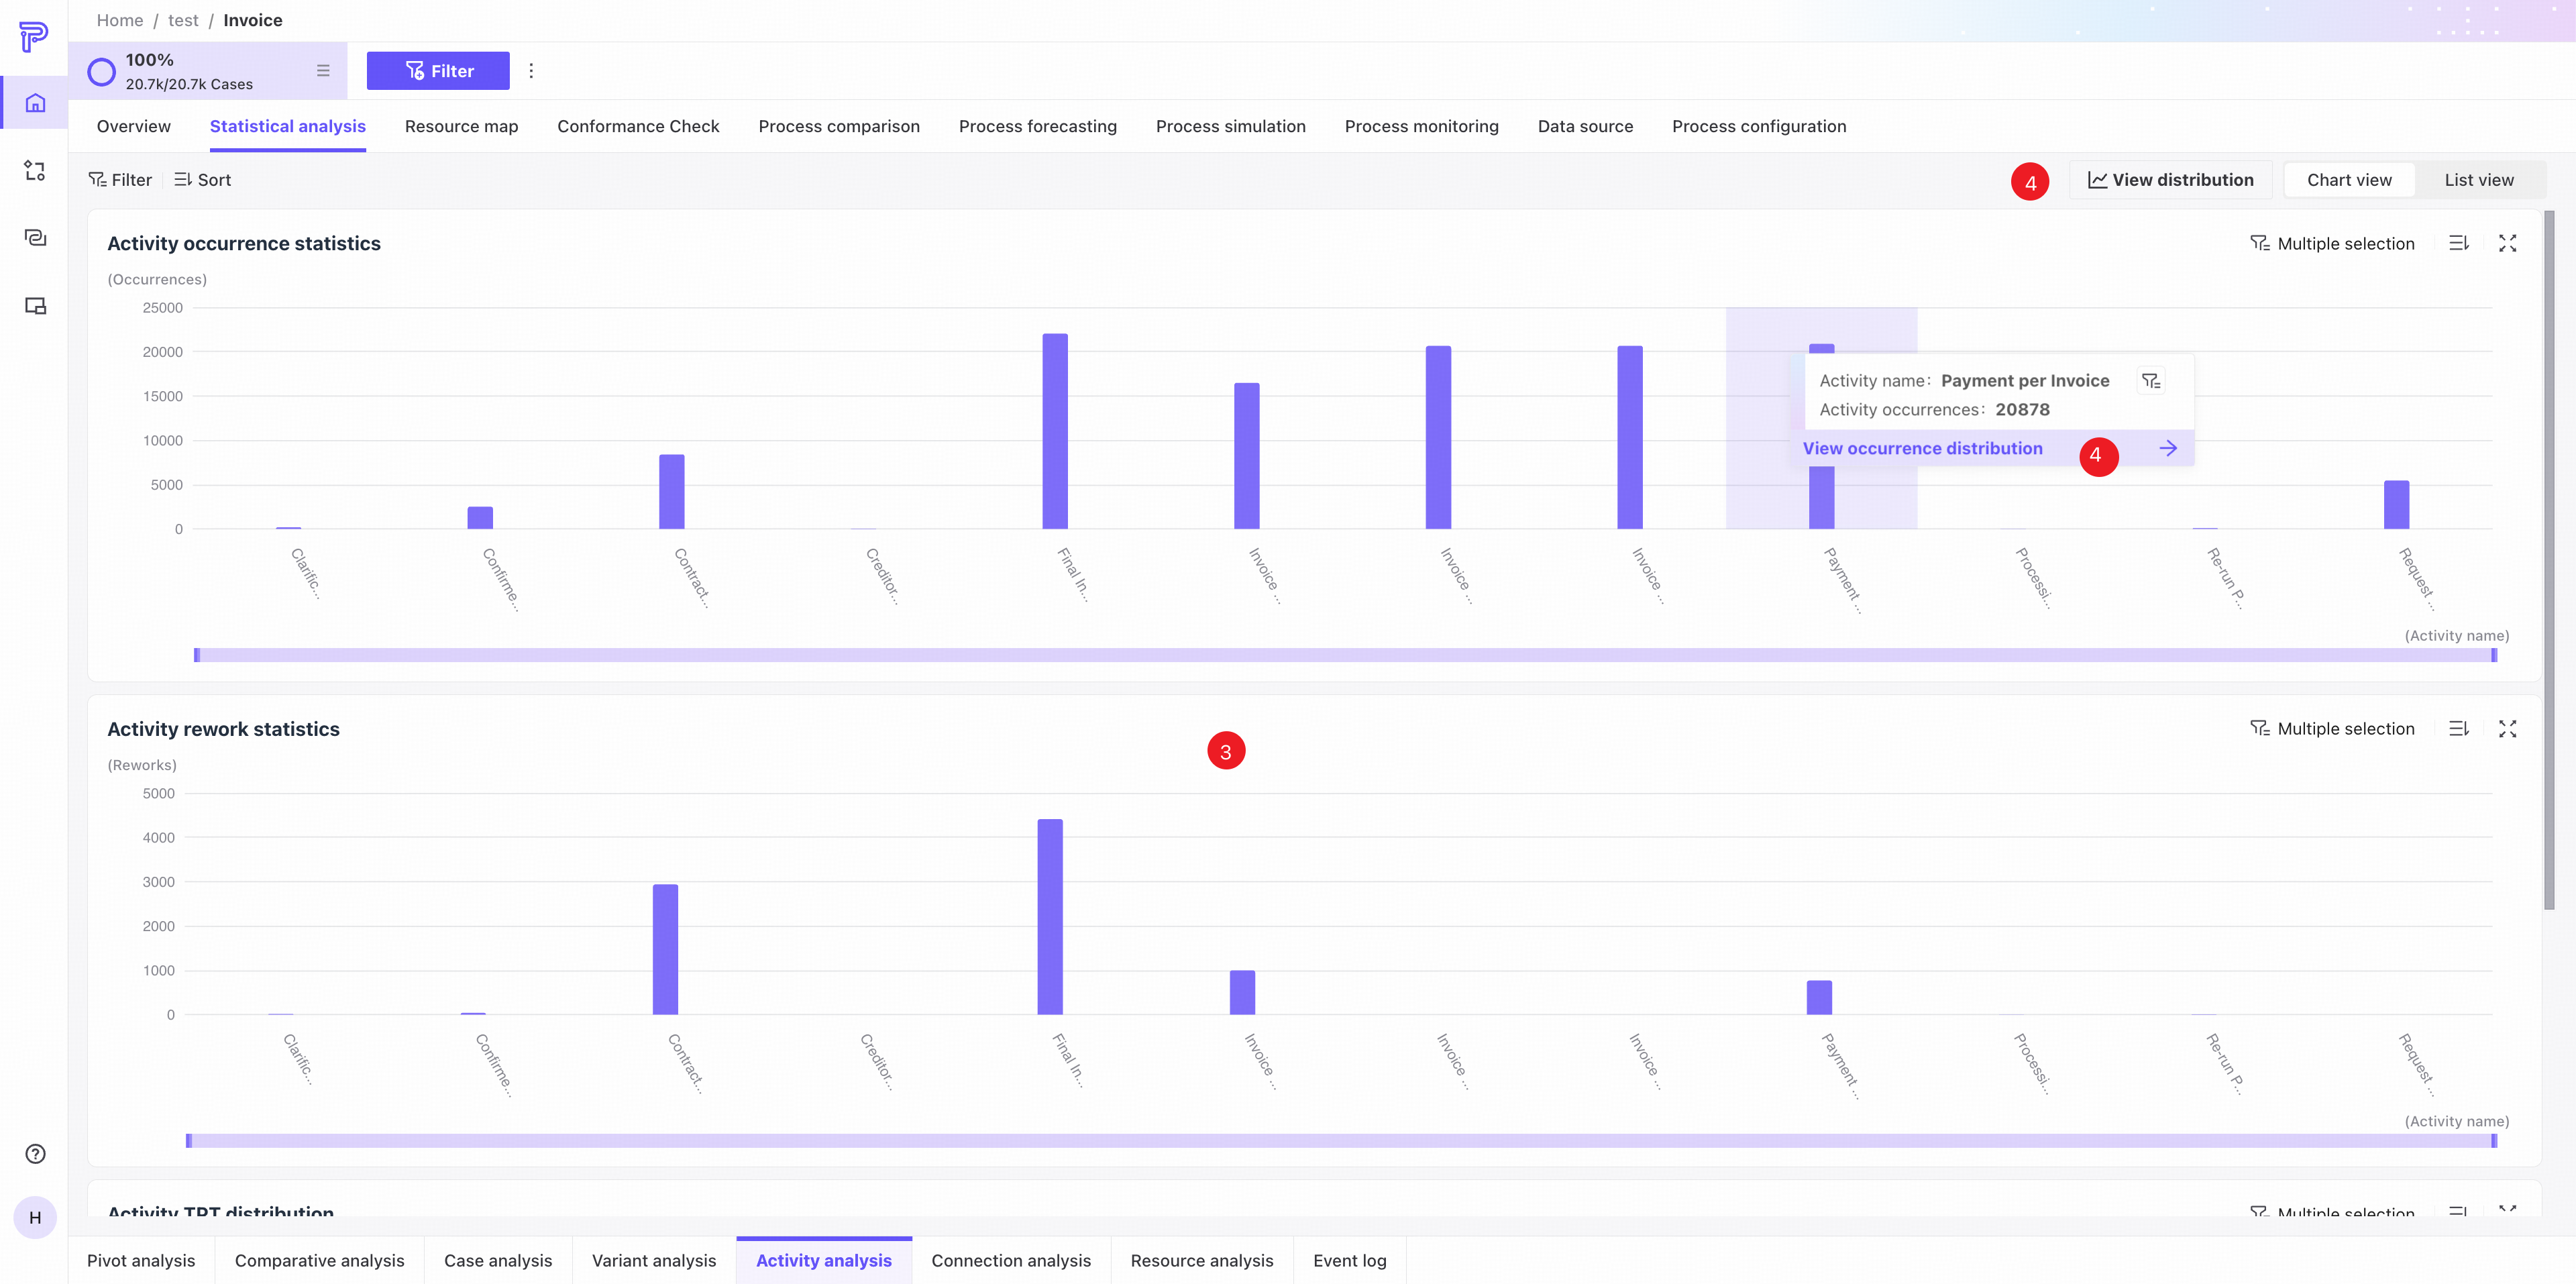
❸ Activity throughput time distribution.
- The box plots show throughput time distributions by activity. Hover to see details for an activity.
- Hover over an outlier to see case information. Click View case details in the Event log tab to open its details.
❹ Click View distribution in a hover popover or in the upper-right corner of the page to open the distribution view.
Distribution view
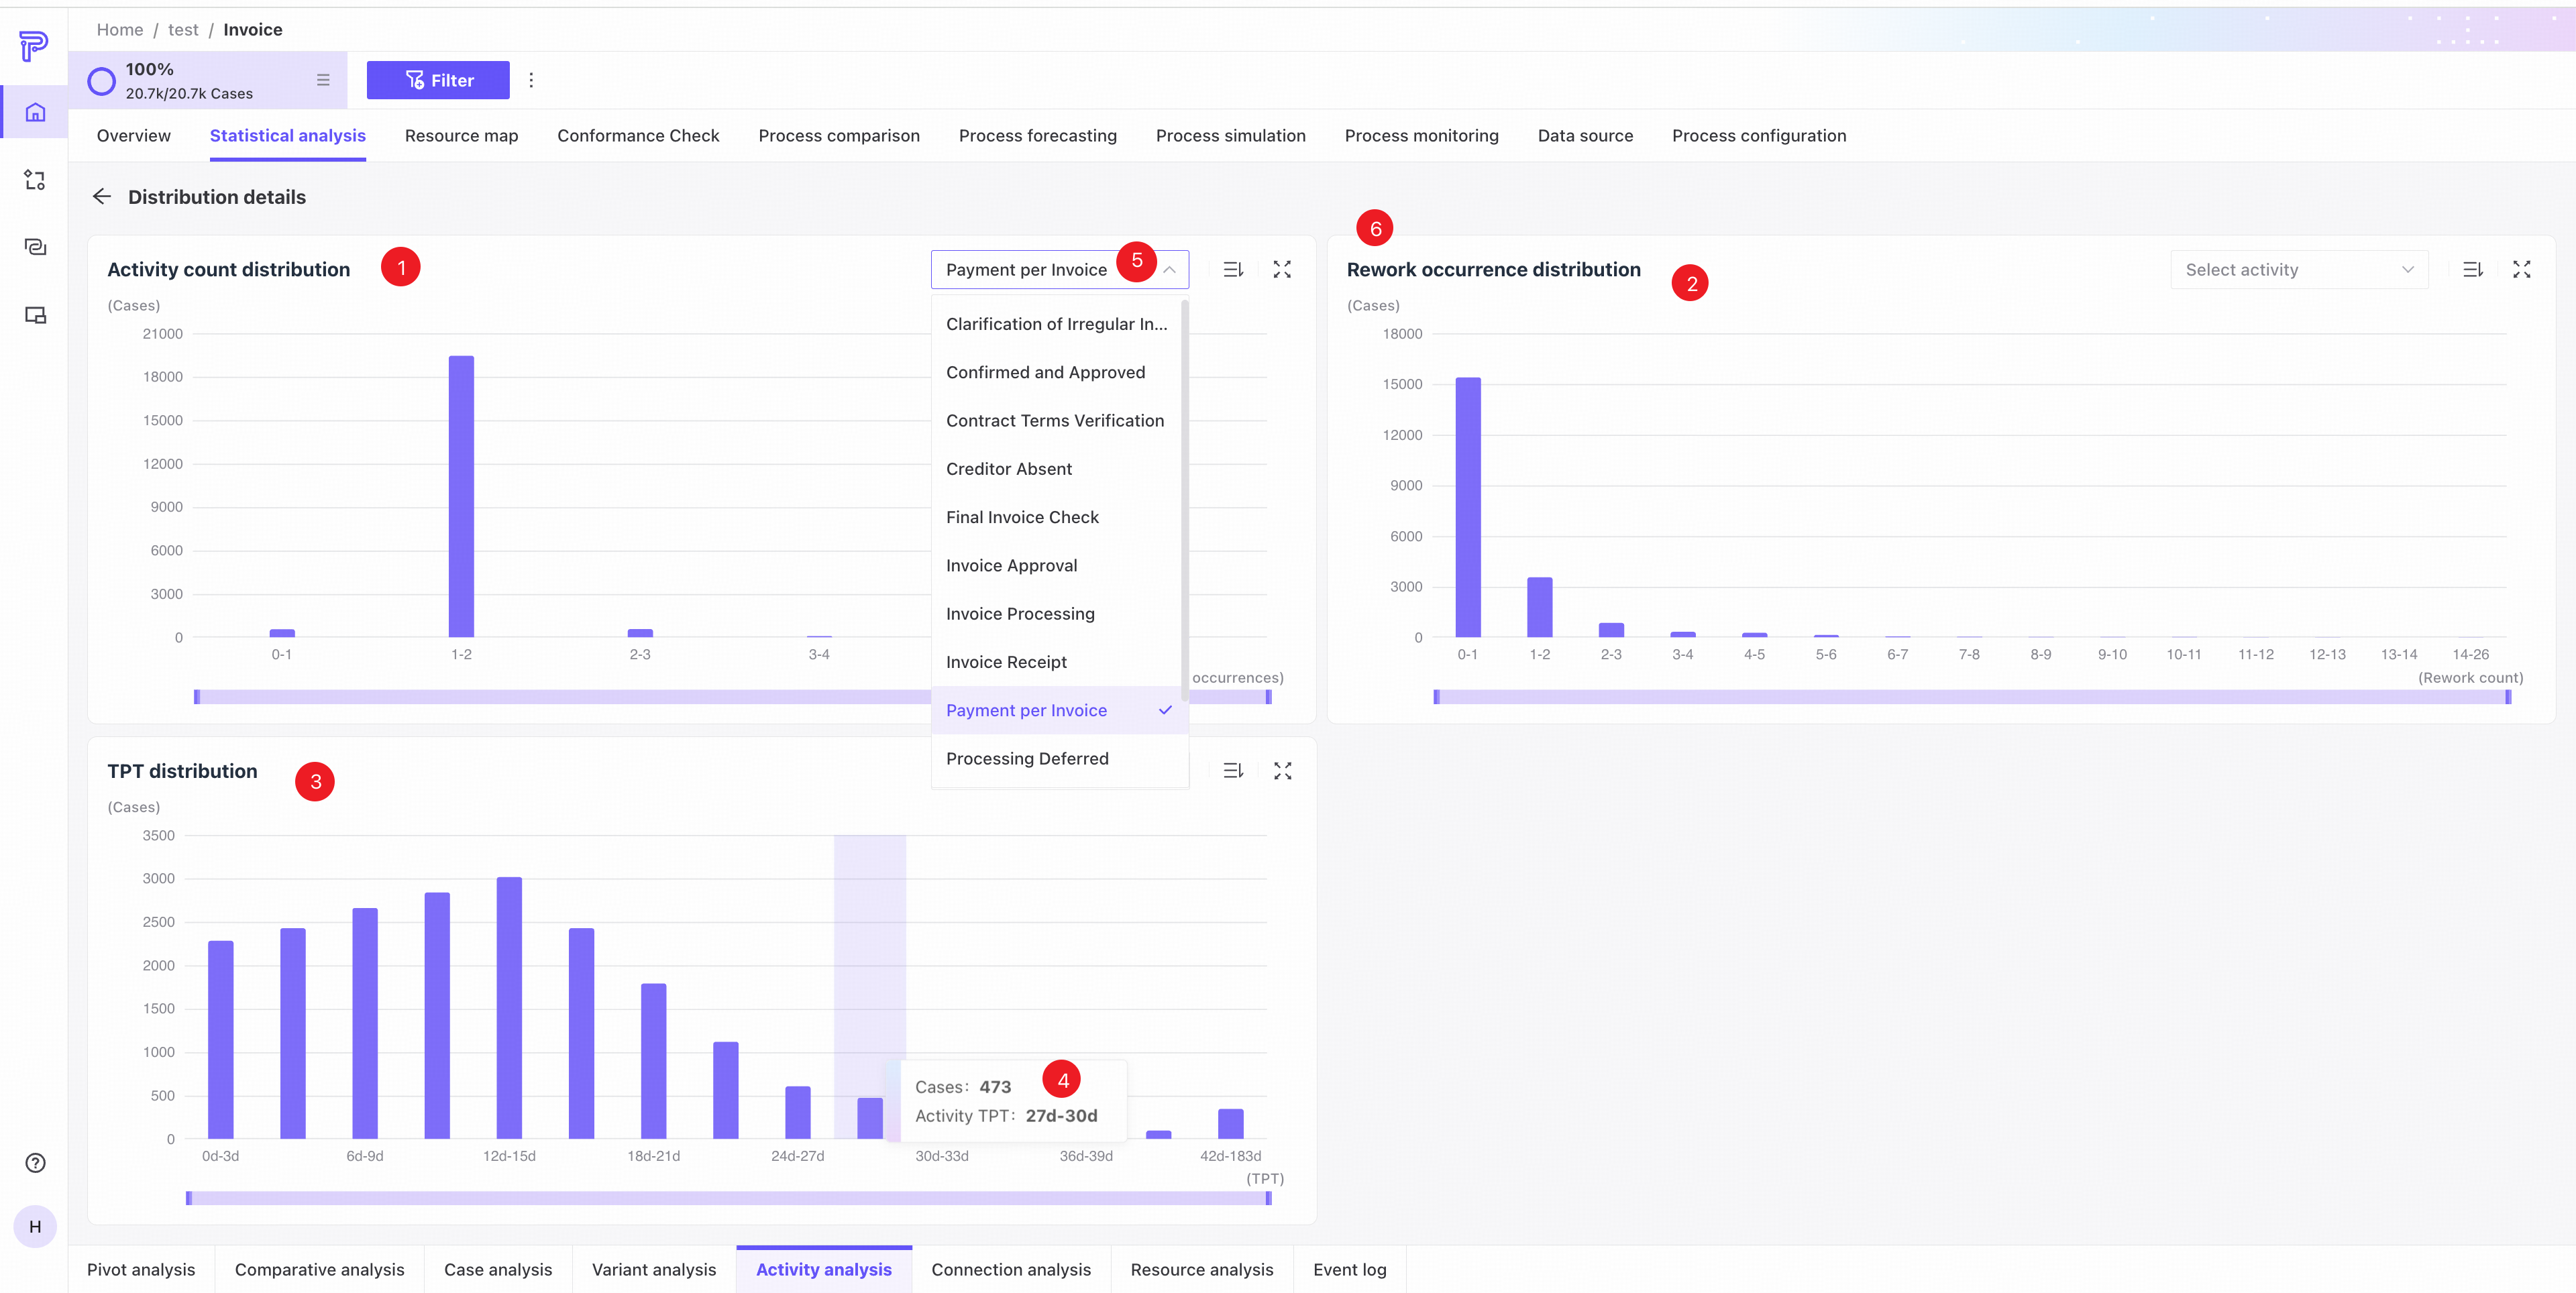
❶ Case activity count distribution: case counts by activity count range in the current process.
❷ Case rework count distribution: case counts by rework count range in the current process.
❸ Case throughput time distribution: case counts by throughput time range in the current process.
❹ Hover to see the corresponding data.
❺ Select an activity from the dropdown in the upper-right corner of a chart to view its data.
❻ The upper-right controls provide sorting and full-screen display.
List view
Use the tabs in the upper-right corner to switch to list view.
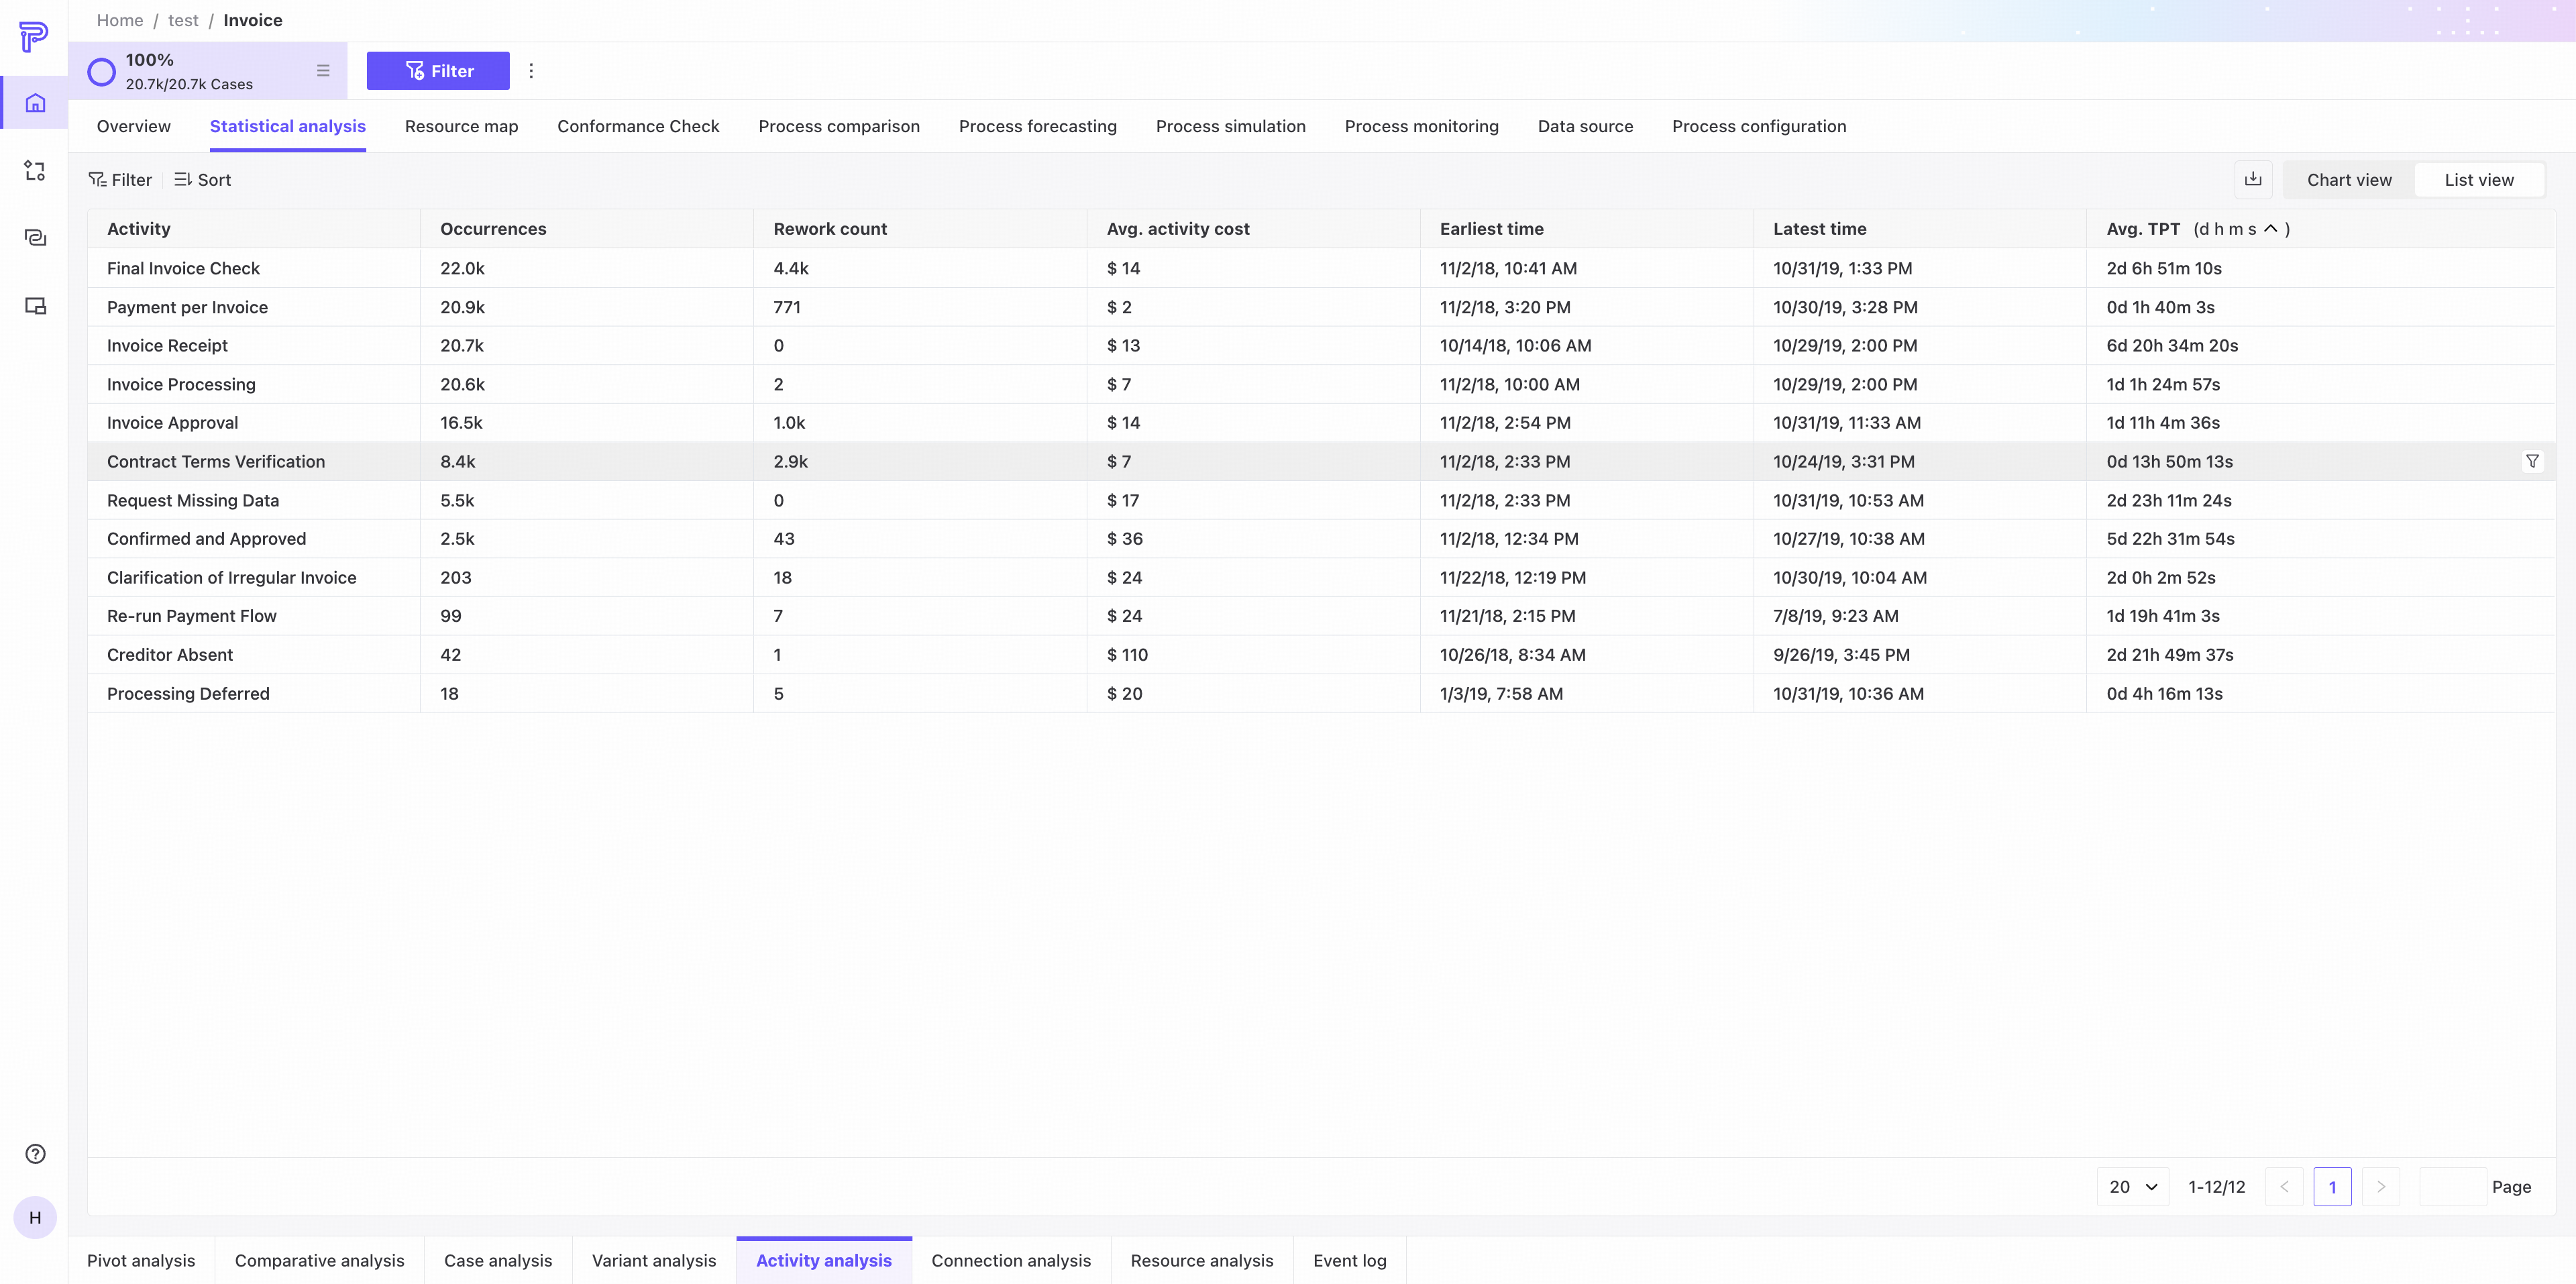
The list shows activity name, frequency, rework count, earliest time, latest time, and average throughput time for all activities in the current process.
Edge analysis
Edge analysis examines data at the edge level and provides chart and list views.
Chart view
Use the tabs in the upper-right corner to switch to chart view.
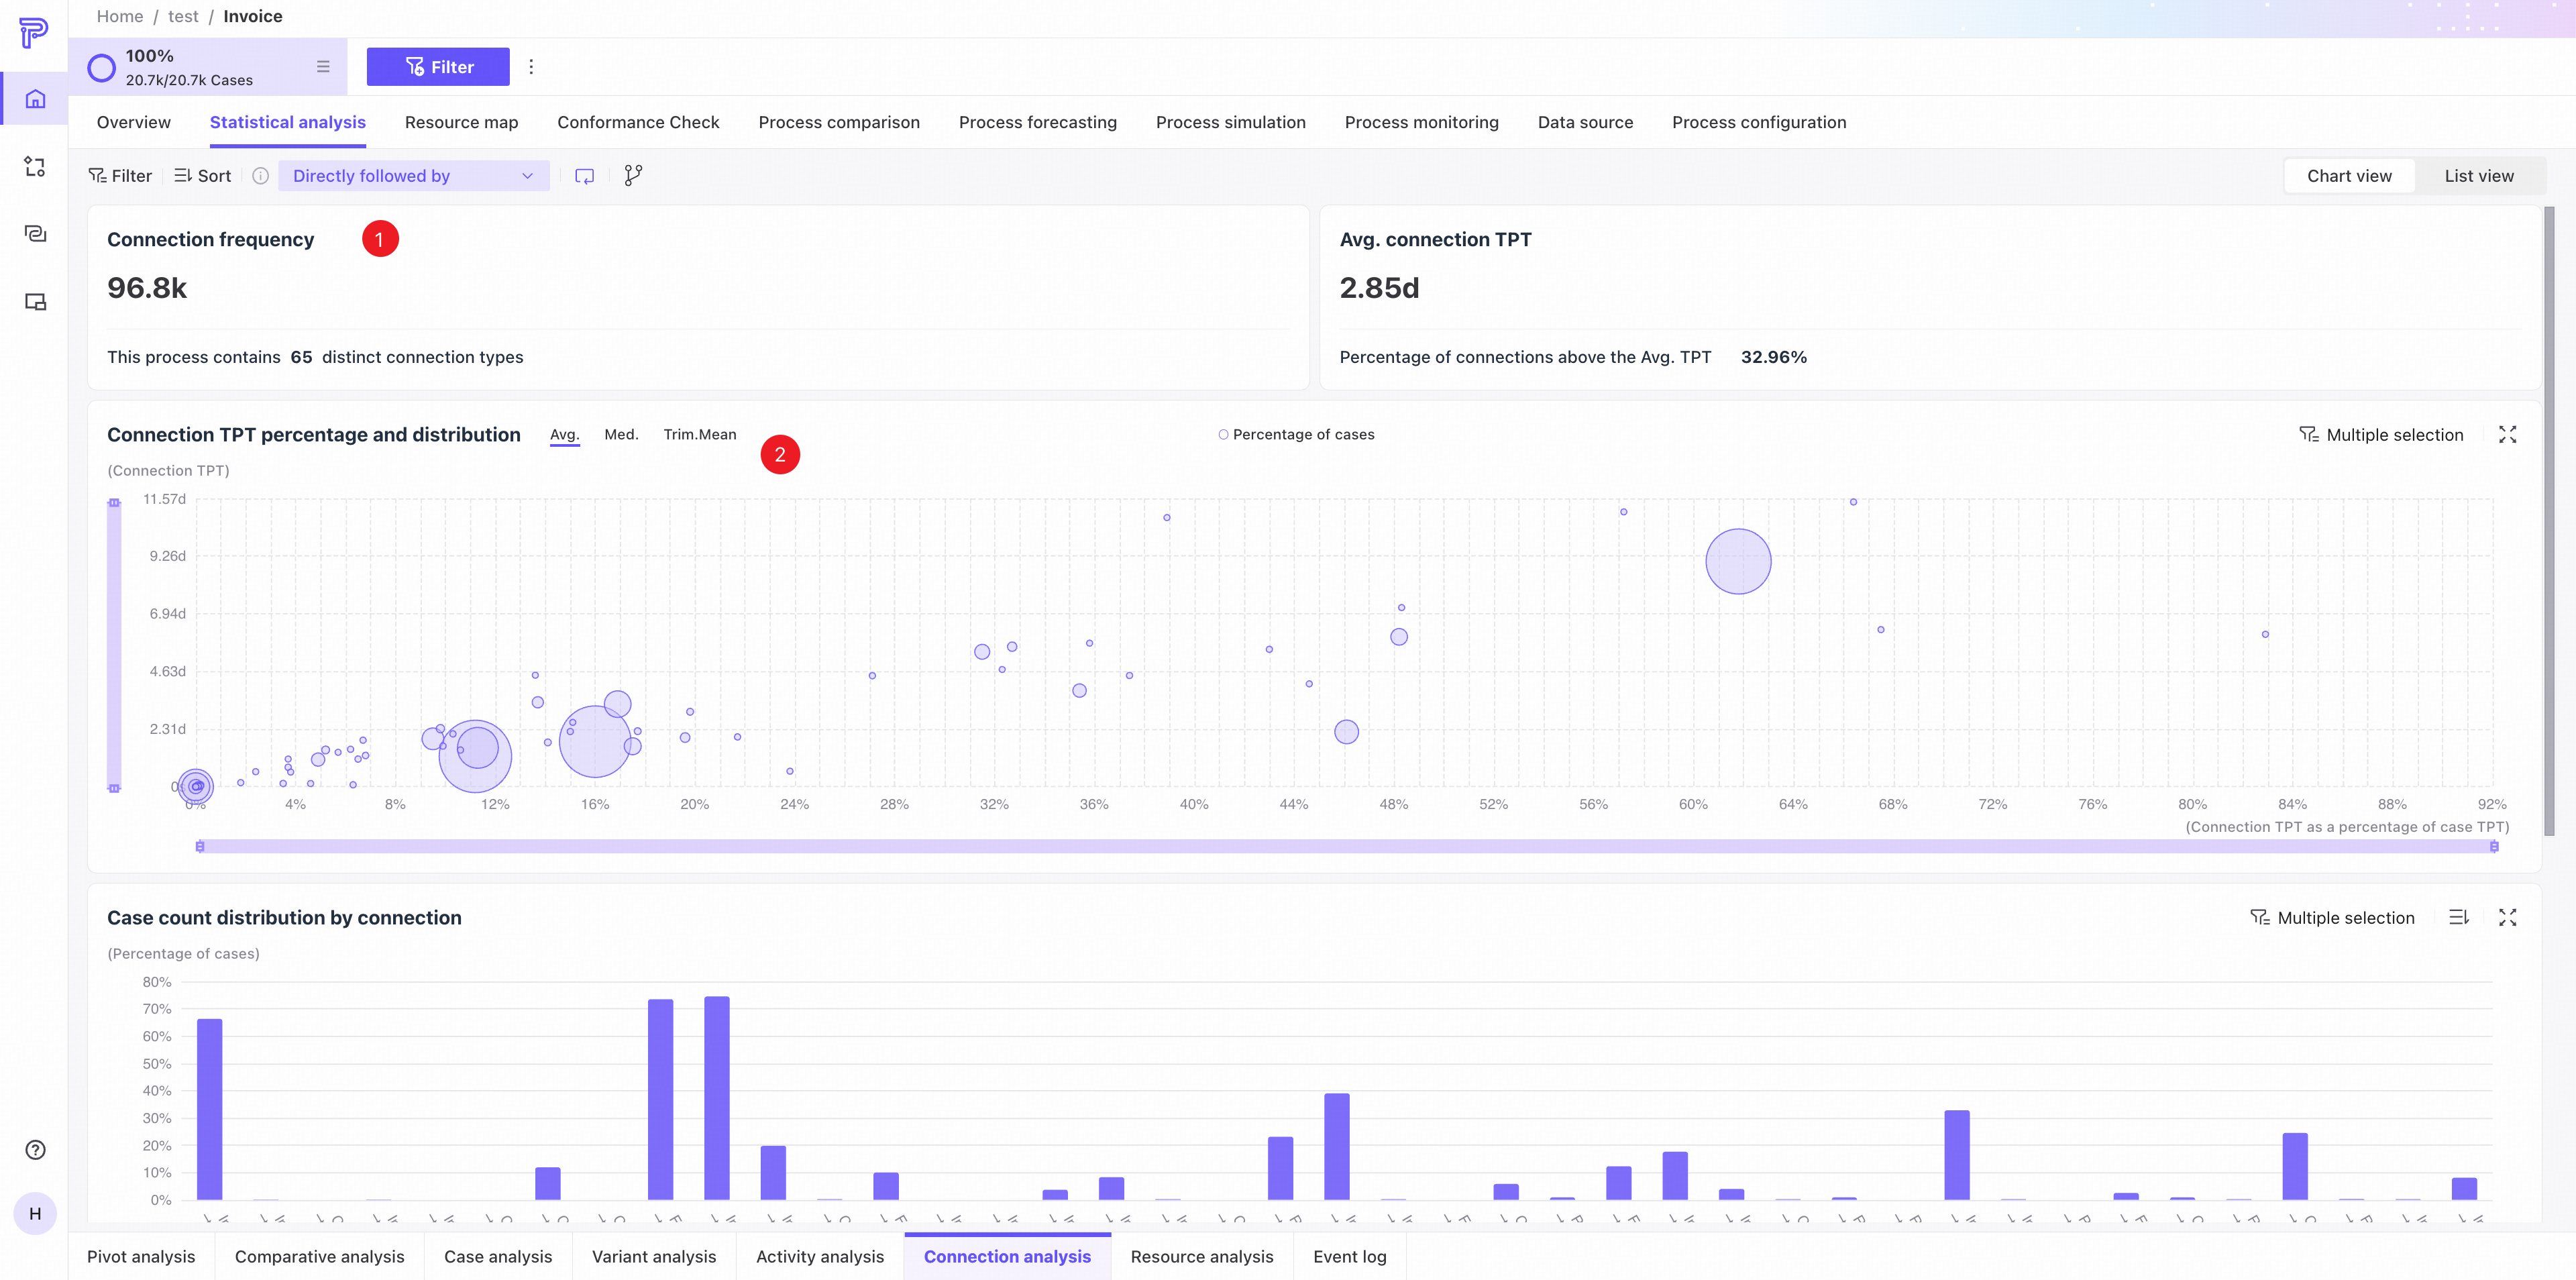
❶ KPI area: edge occurrences, distinct edge types, average edge throughput time, and the percentage of edges exceeding the average throughput time.
❷ Edge throughput time share and distribution: a bubble chart shows each edge's share and distribution of throughput time. Switch between mean, median, and trimmed mean.
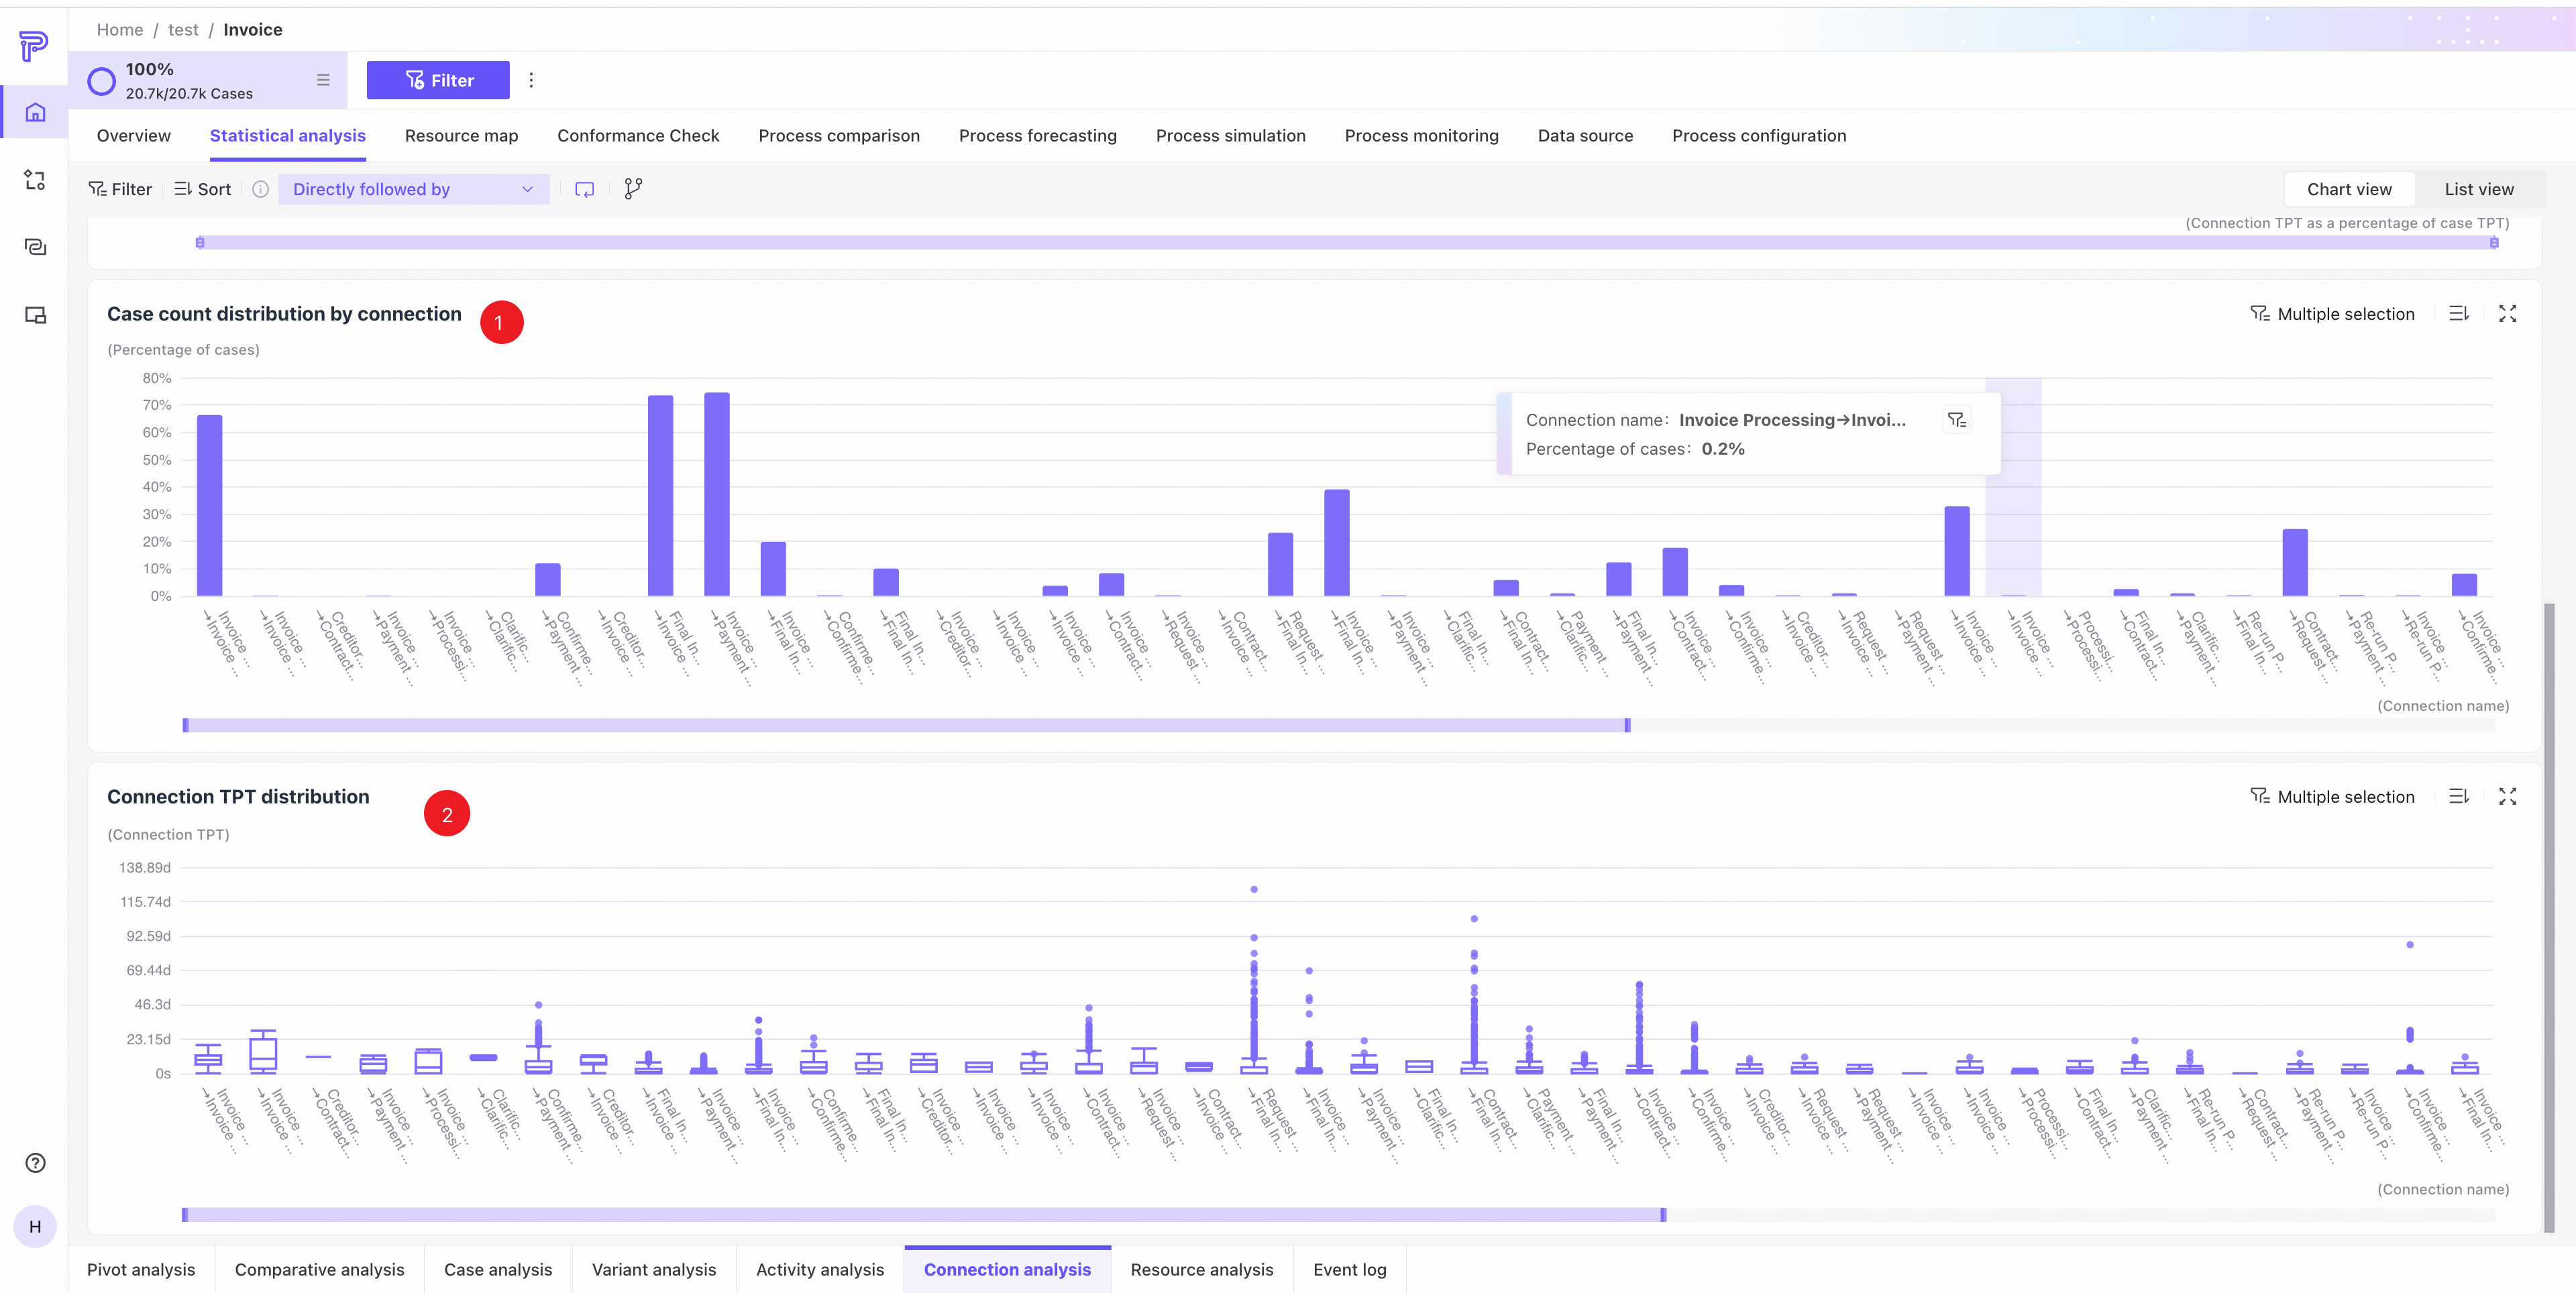
❸ Edge case distribution: the percentage of cases for each edge in the current process.
❹ Edge throughput time distribution.
- The box plots show throughput time distributions by edge. Hover to see details for an edge.
- Hover over an outlier to see case information. Click View case details in the Event log tab to open its details.
List view
Use the tabs in the upper-right corner to switch to list view.
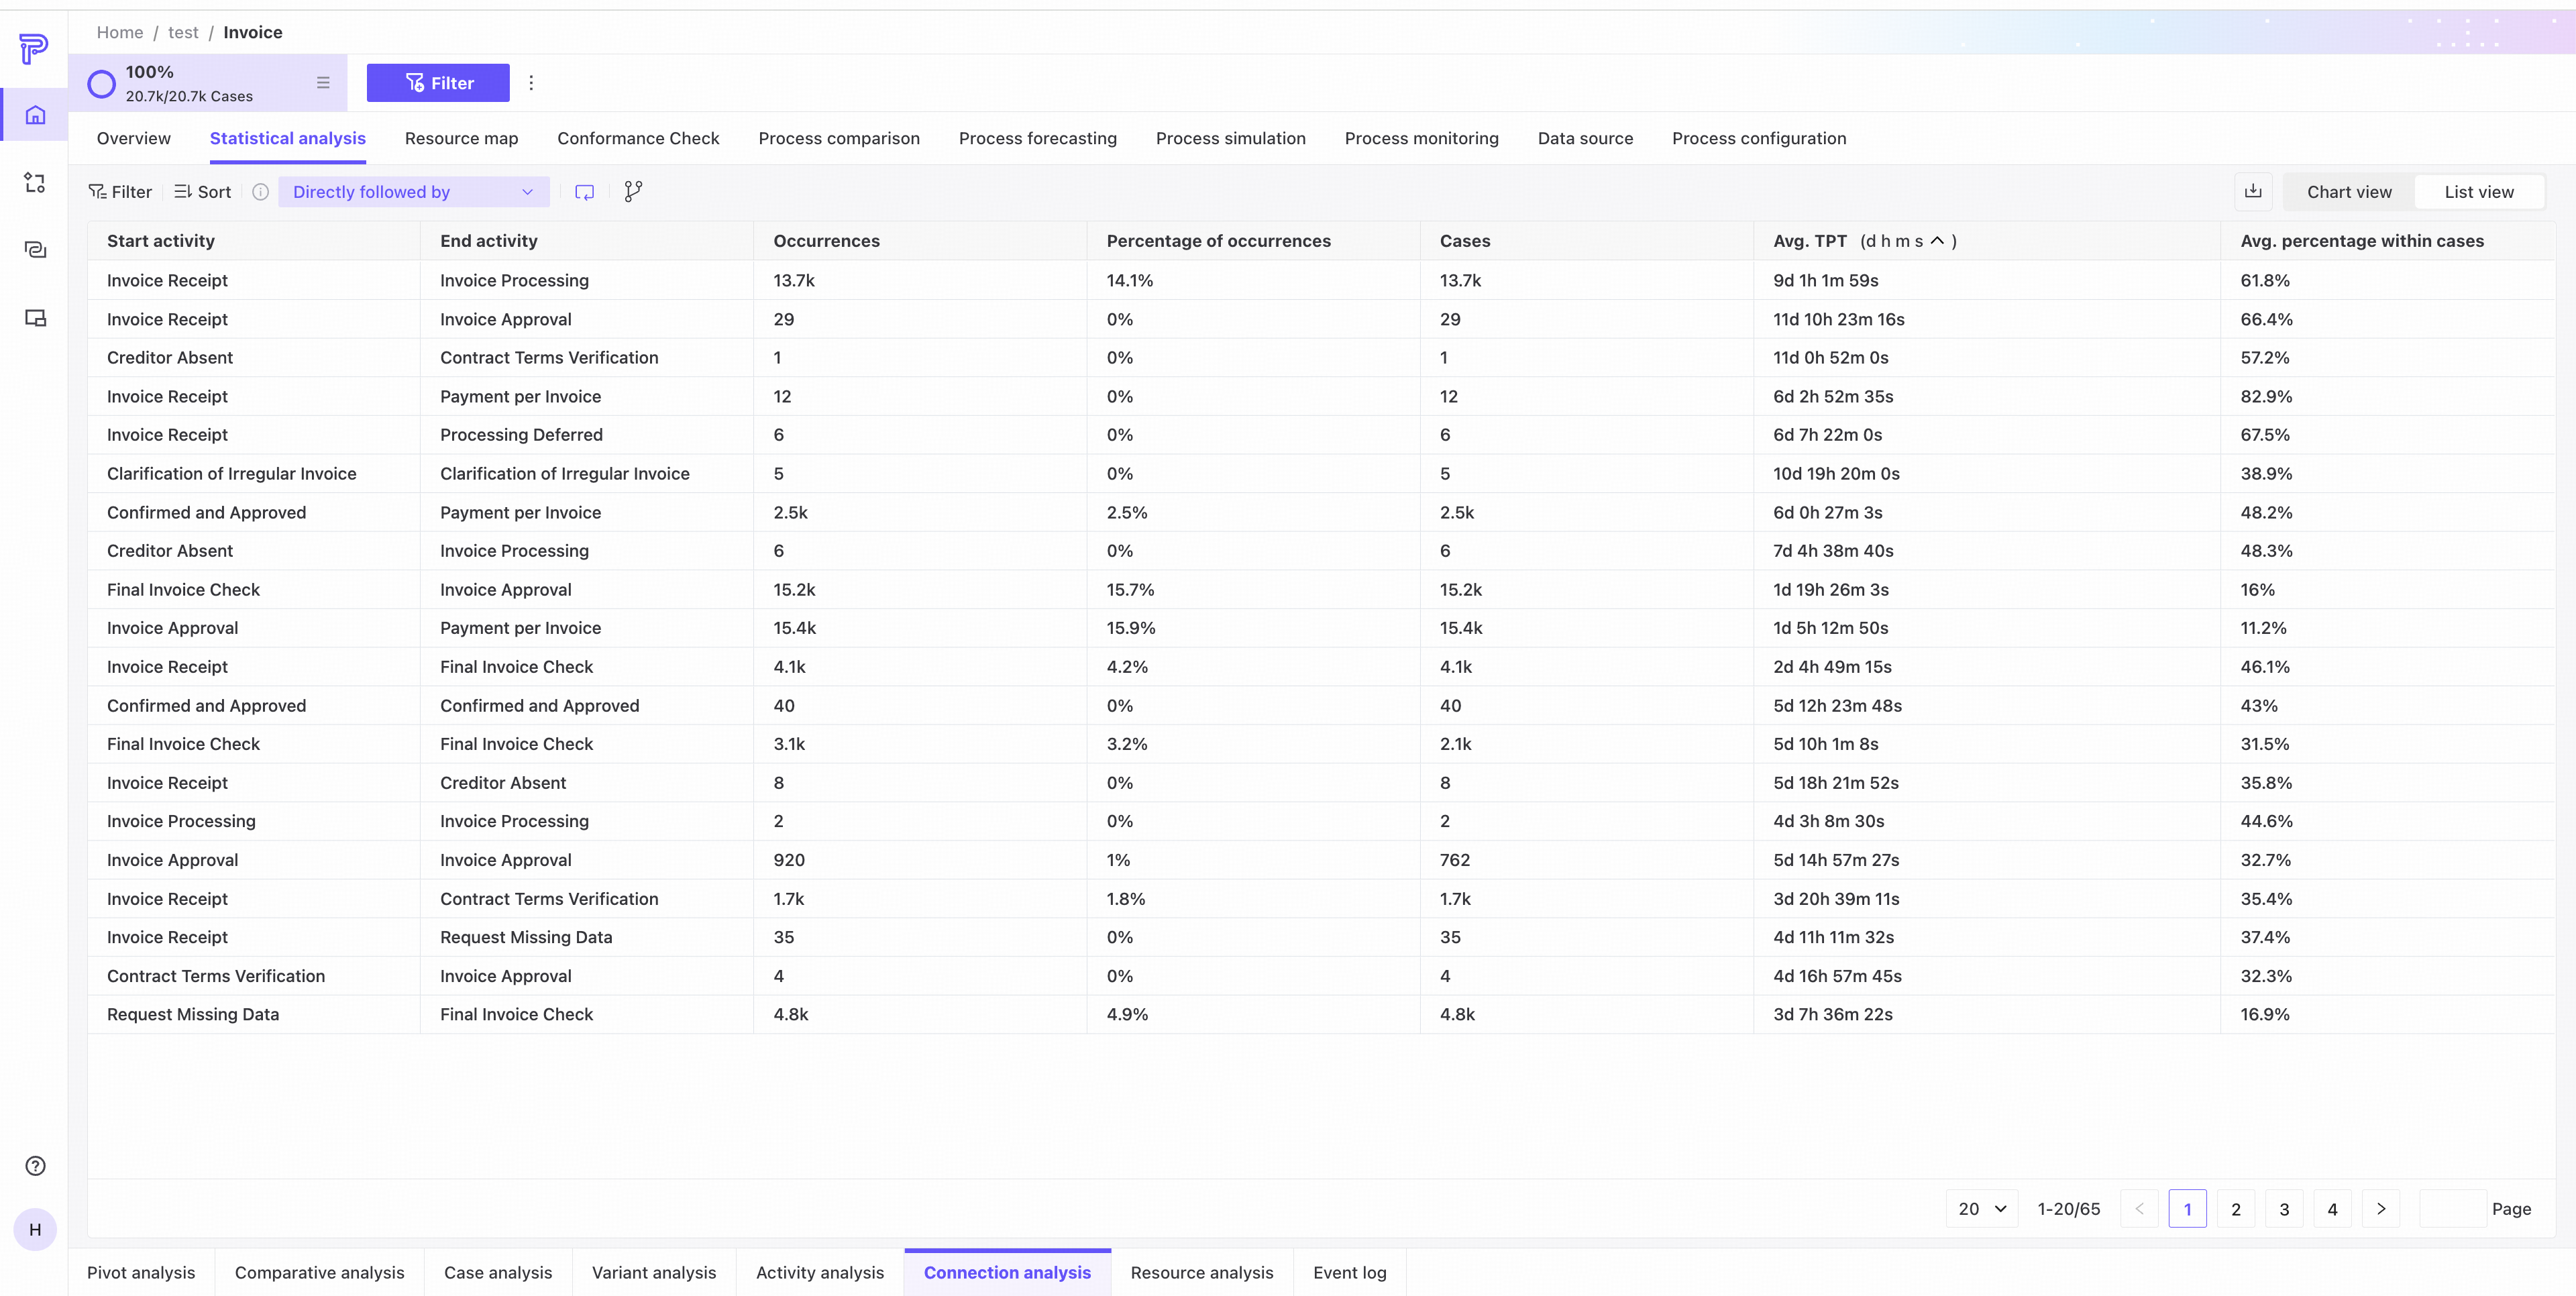
The list shows start activity, end activity, frequency, percentage of occurrences, case count, average throughput time, and average within-case share for every edge in the current process.
Edge analysis dimensions
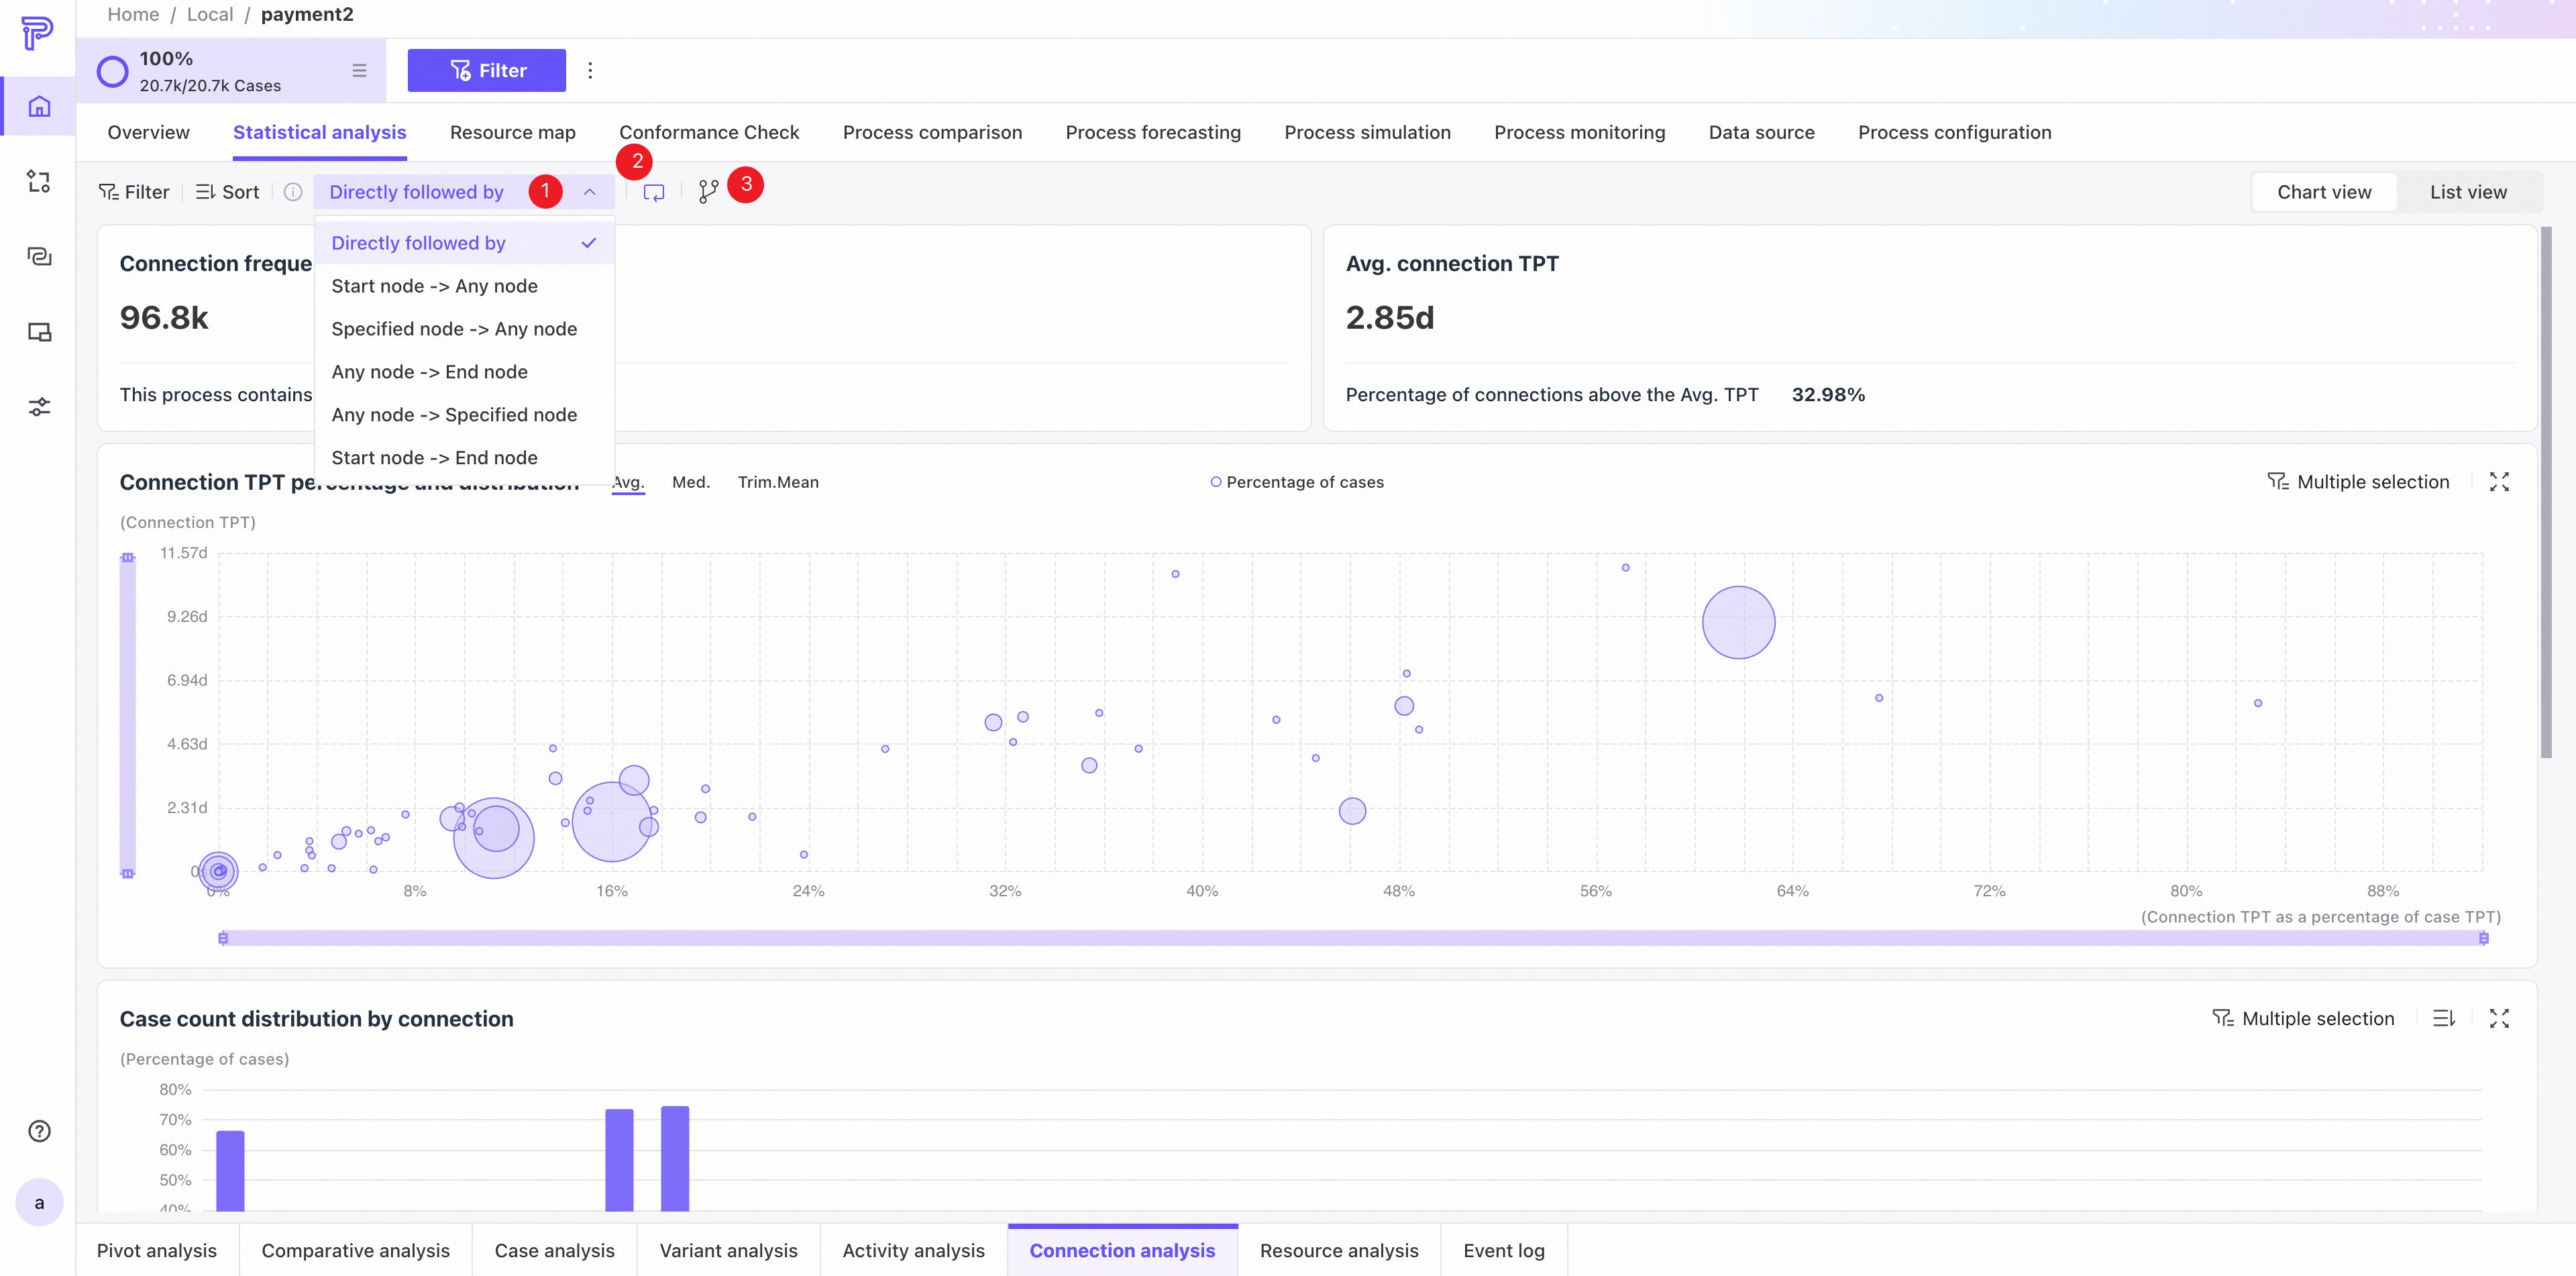
Customize which edges to analyze by choosing the following relationship between nodes, whether to ignore self-loops, and whether to include virtual Start and End nodes.
❶ Available following relationships, using A -> B -> C -> D -> E as an example:
- Directly follows: actual edges between adjacent nodes.
Result: A -> B, B -> C, C -> D, D -> E - Start node -> Any node: edges from start activity A to all subsequent activities.
Result: A -> B, A -> C, A -> D, A -> E - Specified node -> Any node: select a node, such as B, to show edges from it to all subsequent activities.
Result: B -> C, B -> D, B -> E - Any node -> End node: edges from any node to the end node.
Result: A -> E, B -> E, C -> E, D -> E - Any node -> Specified node: select a node, such as D, to show edges from all preceding nodes to it.
Result: A -> D, B -> D, C -> D - Start node -> End node: only the edge from the start activity to the end activity.
Result: A -> E
❷ Enable or disable self-loops.
❸ Choose whether to display virtual Start and End nodes.
The following example illustrates how these settings work.
Suppose the process is:
A -> B -> B -> C -> B -> D -> B
- Following relationship = Directly follows
The actual edges are:
A -> B
B -> B
B -> C
C -> B
B -> D
D -> B - Ignore self-loops = Enabled
After the self-loop B -> B is ignored:
A -> B
B -> C
C -> B
B -> D
D -> B - Show virtual nodes = Enabled
After virtual nodes are added at the start and end:
Start -> A
A -> B
B -> C
C -> B
B -> D
D -> B
B -> End
Resource analysis
Resource analysis examines data at the resource level and provides chart and list views.
Chart view
Use the tabs in the upper-right corner to switch to chart view.
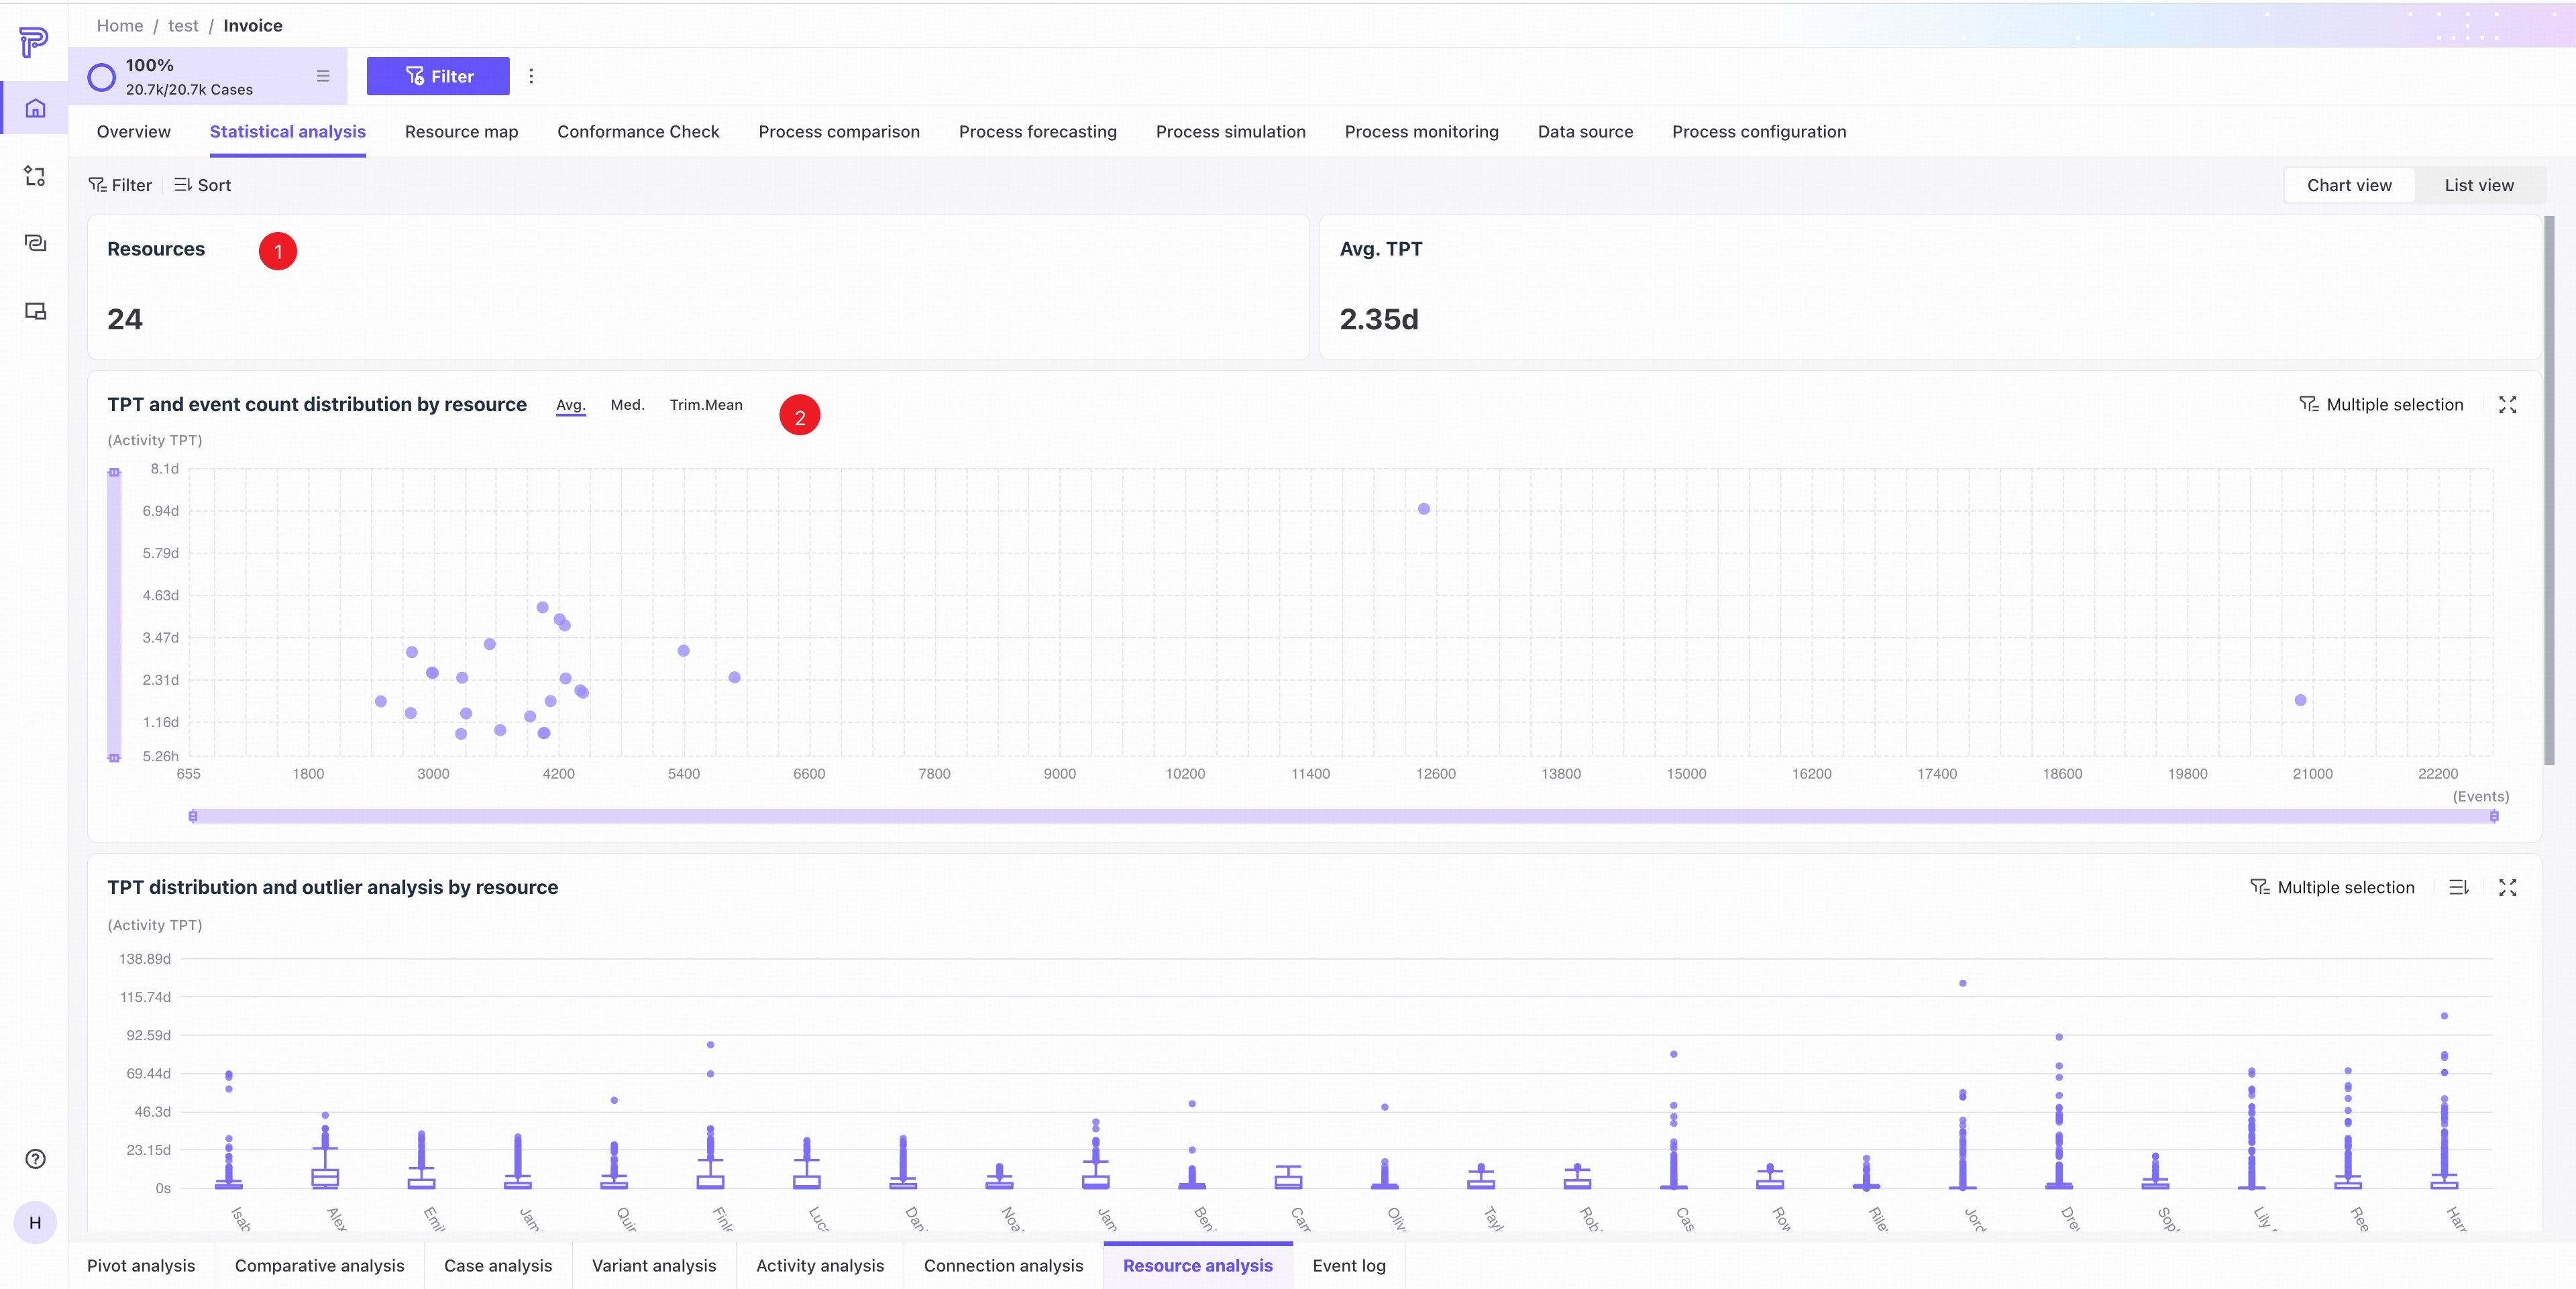
❶ KPI area: distinct resources and average throughput time for the current process.
❷ Resource throughput time and event count distribution: a scatter plot shows throughput time and event count for each resource. Switch between mean, median, and trimmed mean.
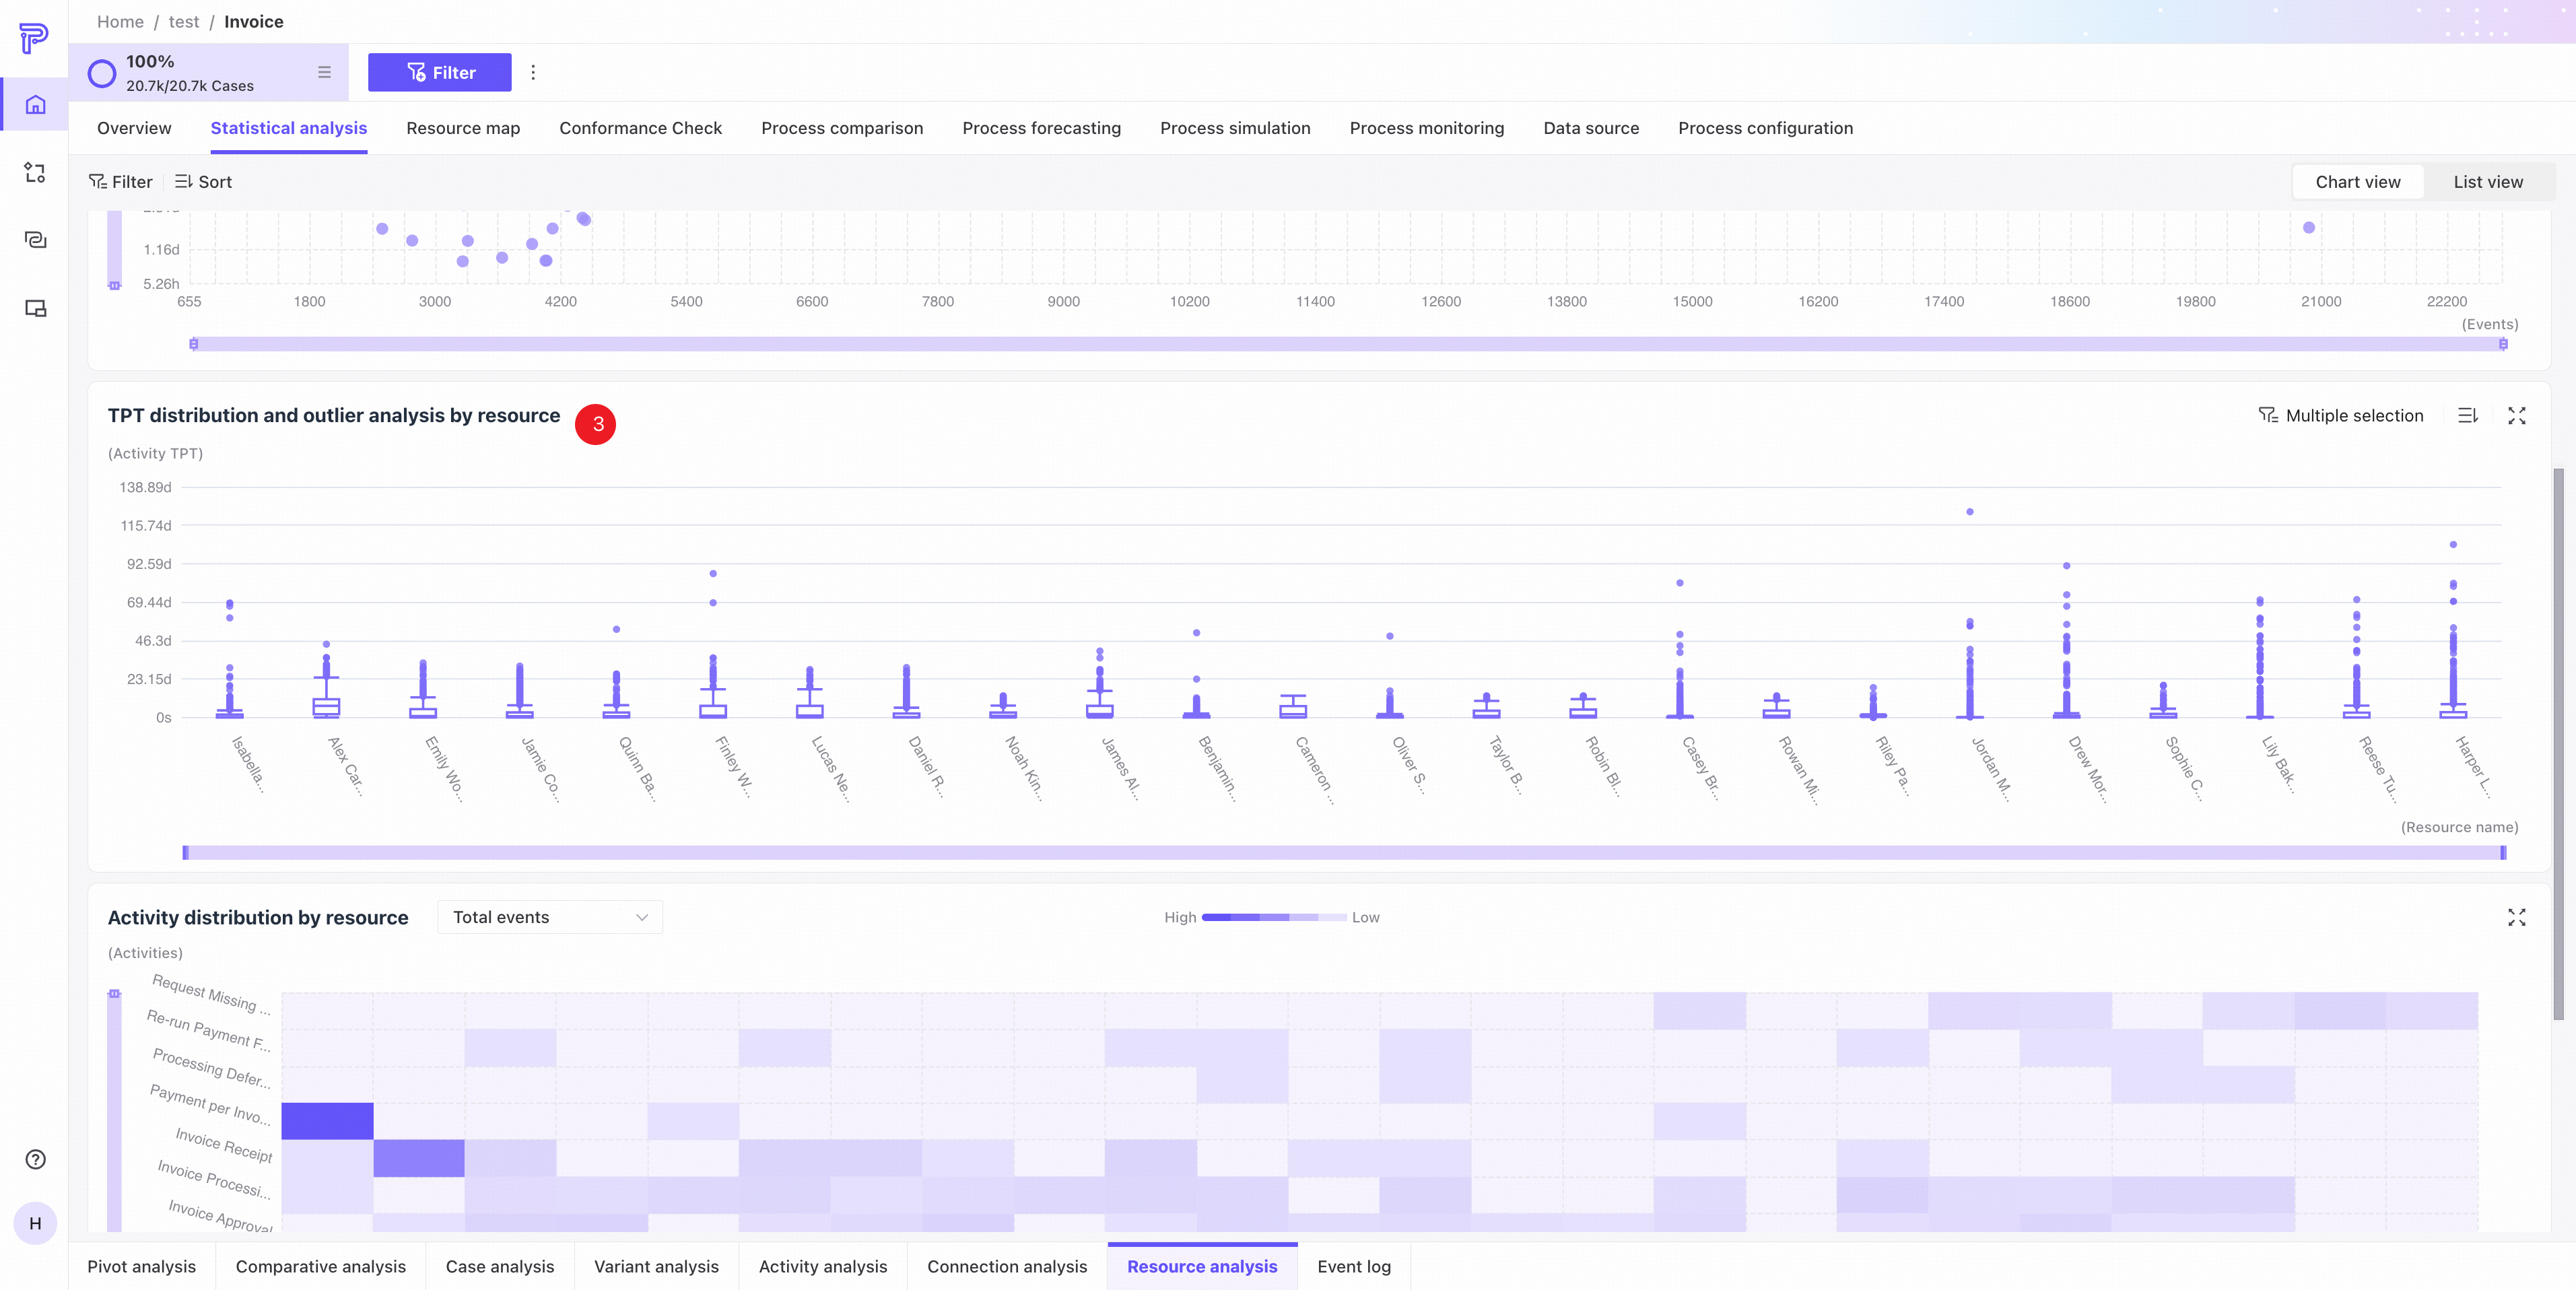
❸ Resource throughput time distribution and outlier analysis.
- The box plots show throughput time distributions by resource. Hover to see details for the selected resource.
- Hover over an outlier to see case information. Click View case details in the Event log tab to open its details.
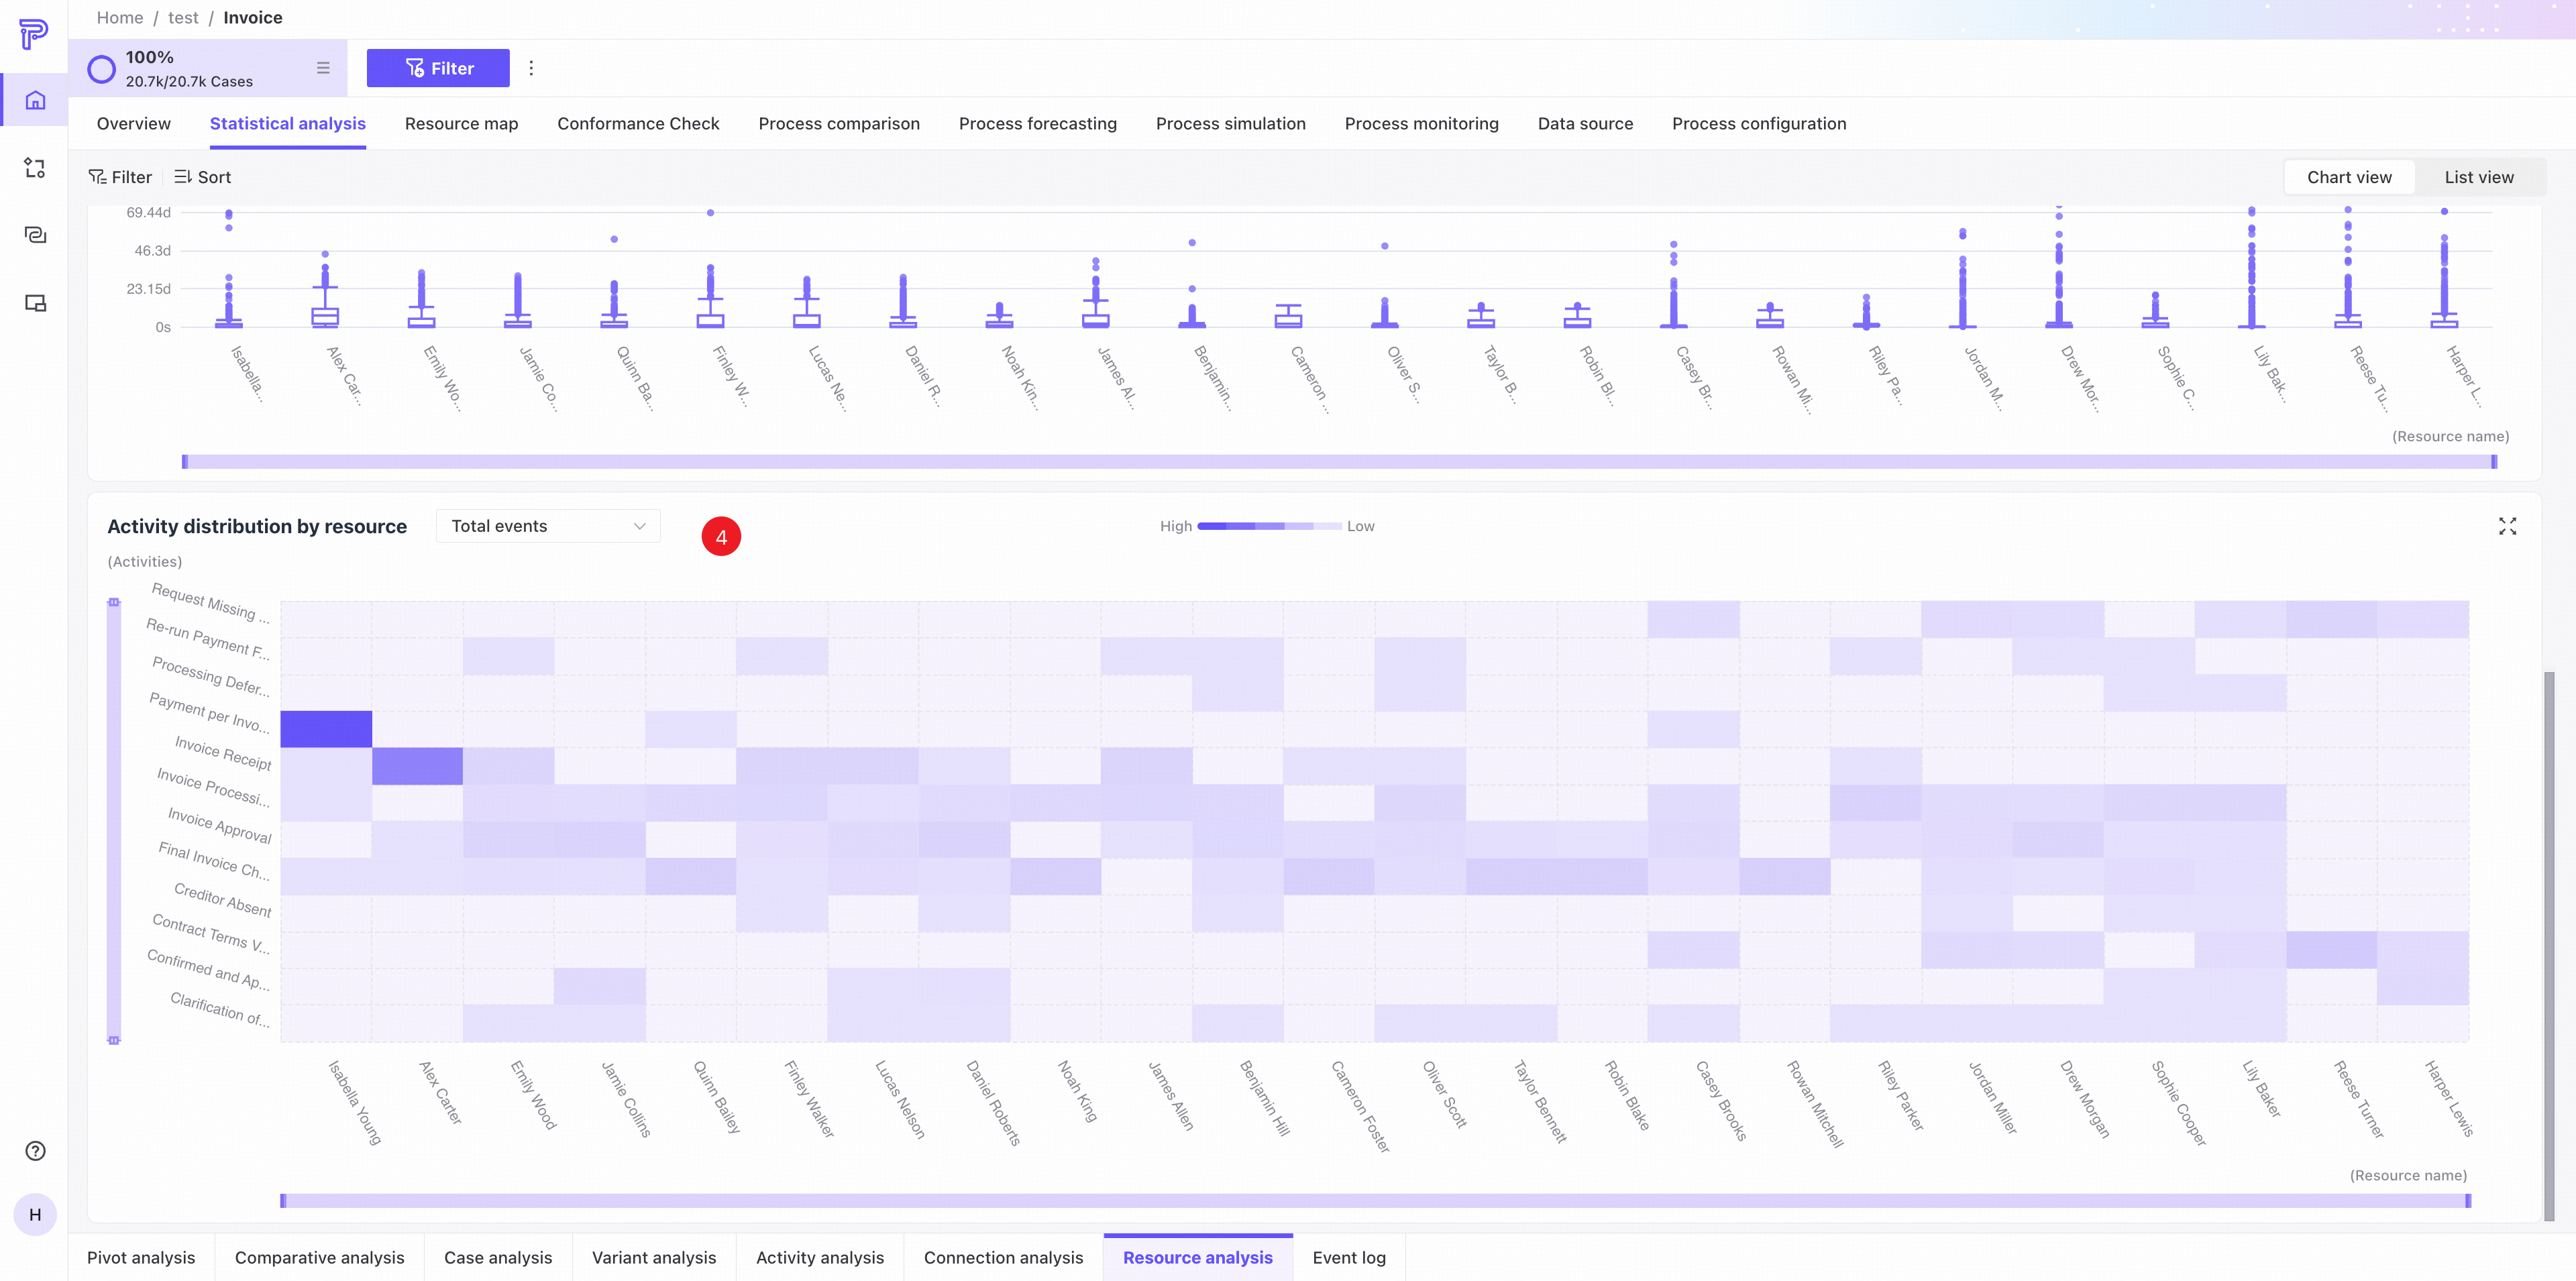
❹ Resource activity distribution: a heat map shows how each resource's work is concentrated across activities. Use the dropdown to switch between event count, rework count, and throughput time.
List view
Use the tabs in the upper-right corner to switch to list view.
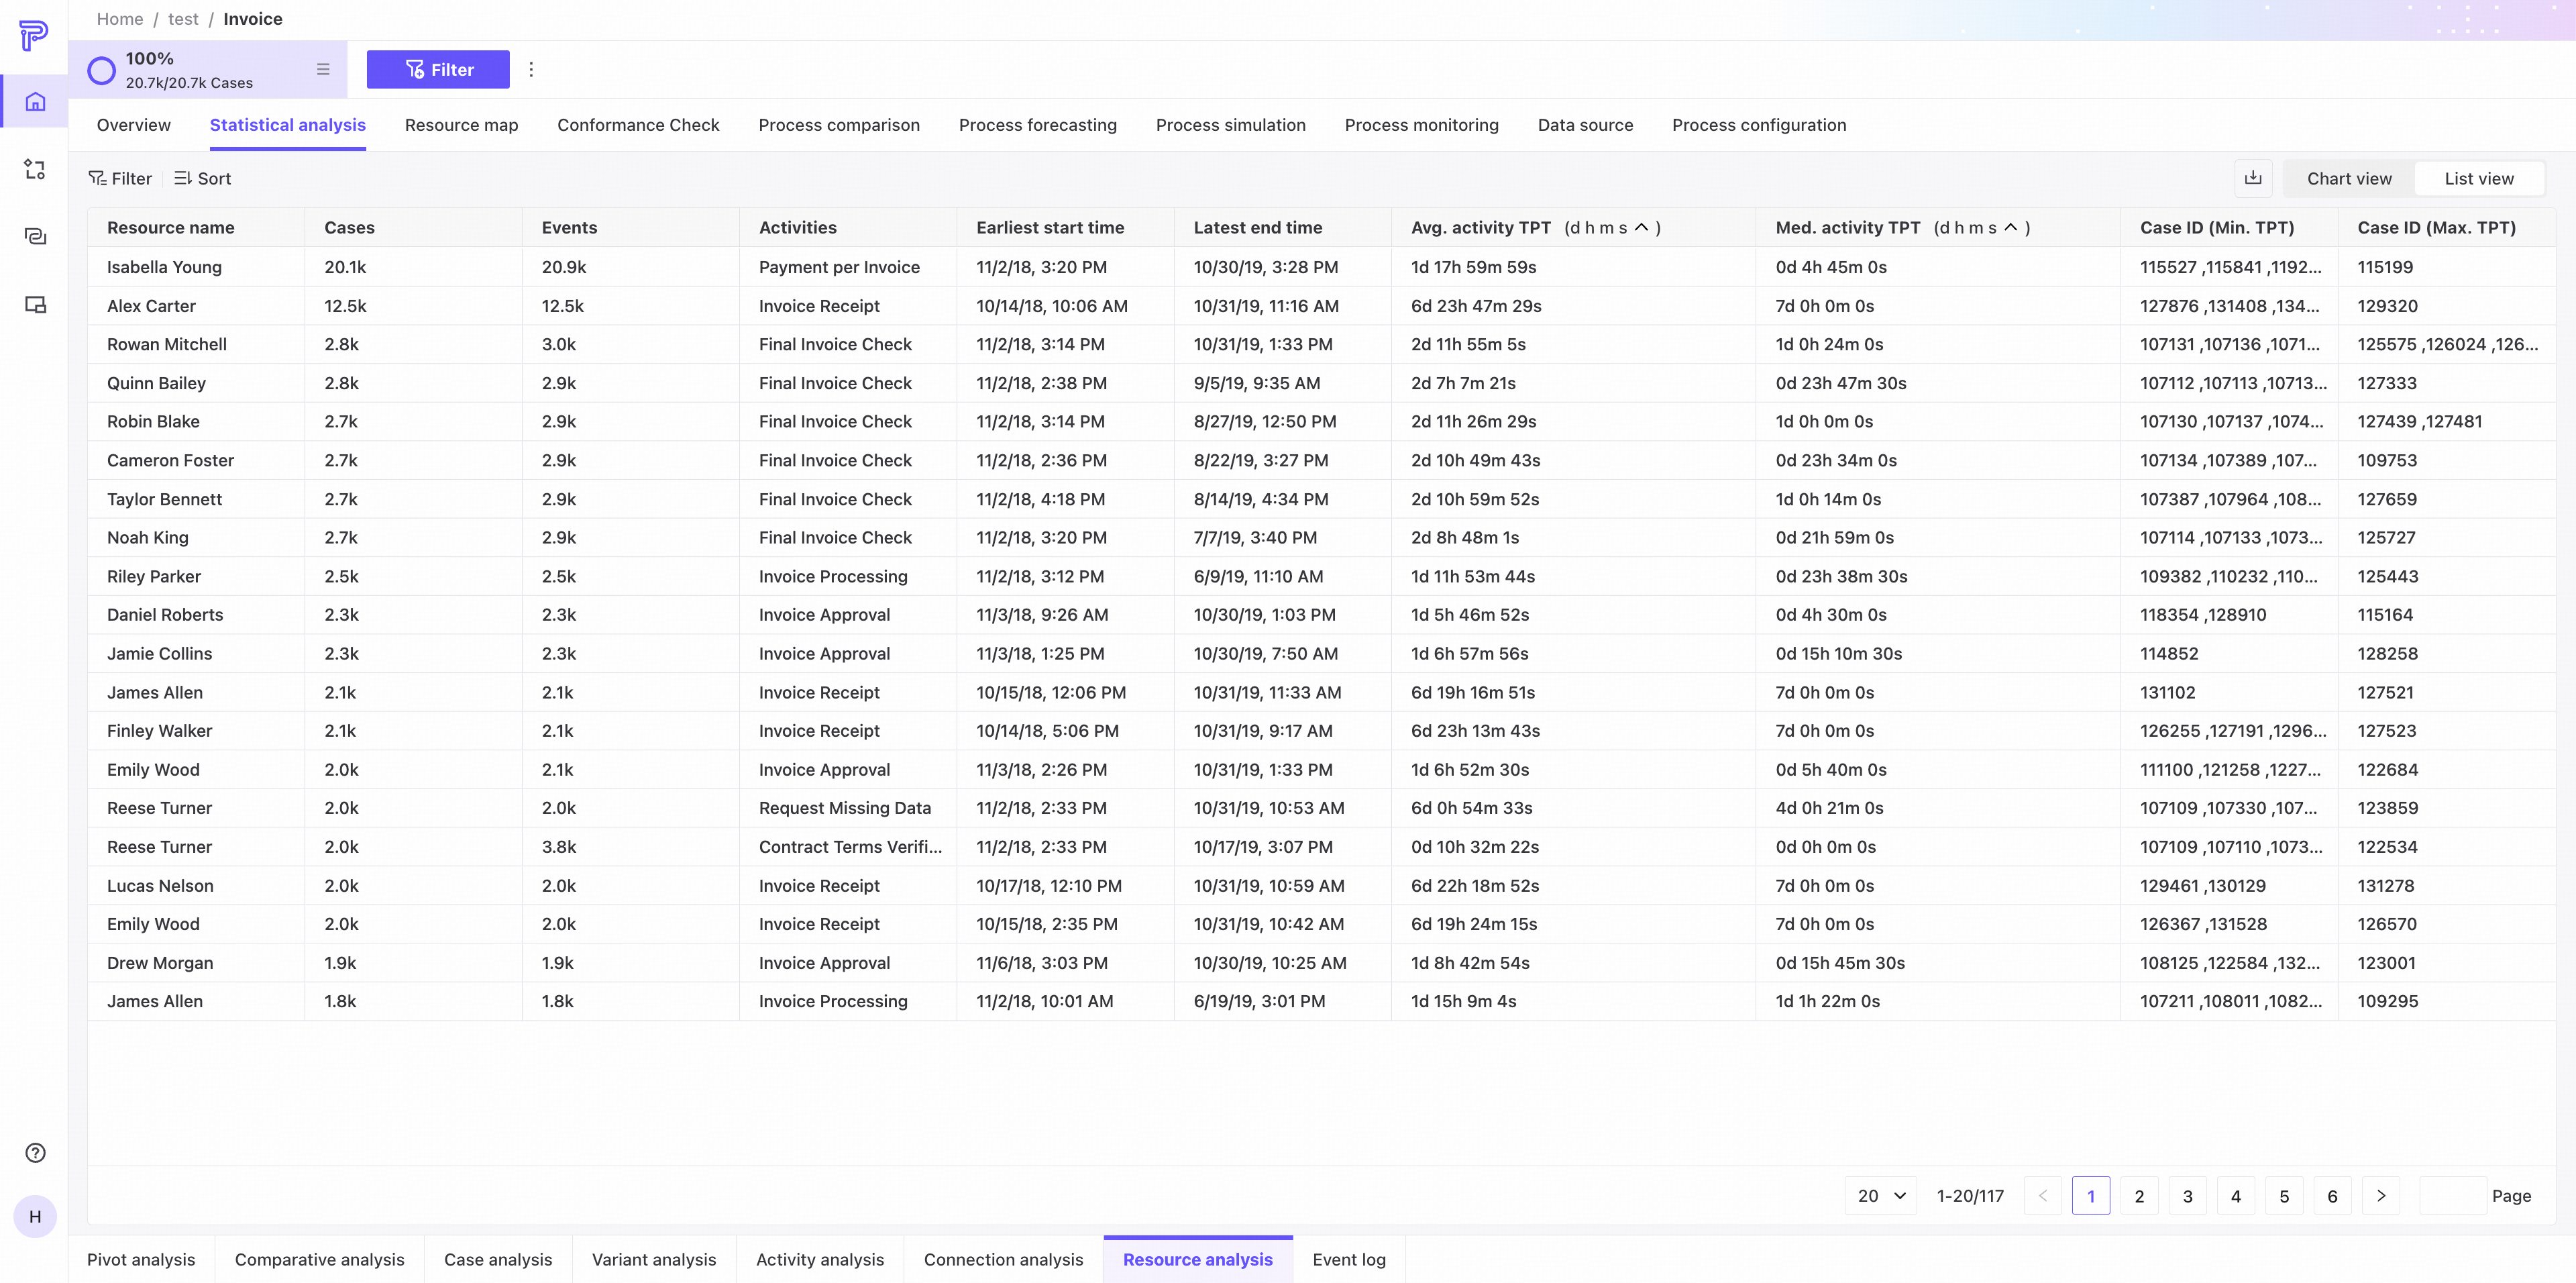
The list shows each resource's name, case count, event count, activities performed, earliest start, latest end, mean/median activity throughput time, and the case IDs with the maximum/minimum throughput time.
Event log
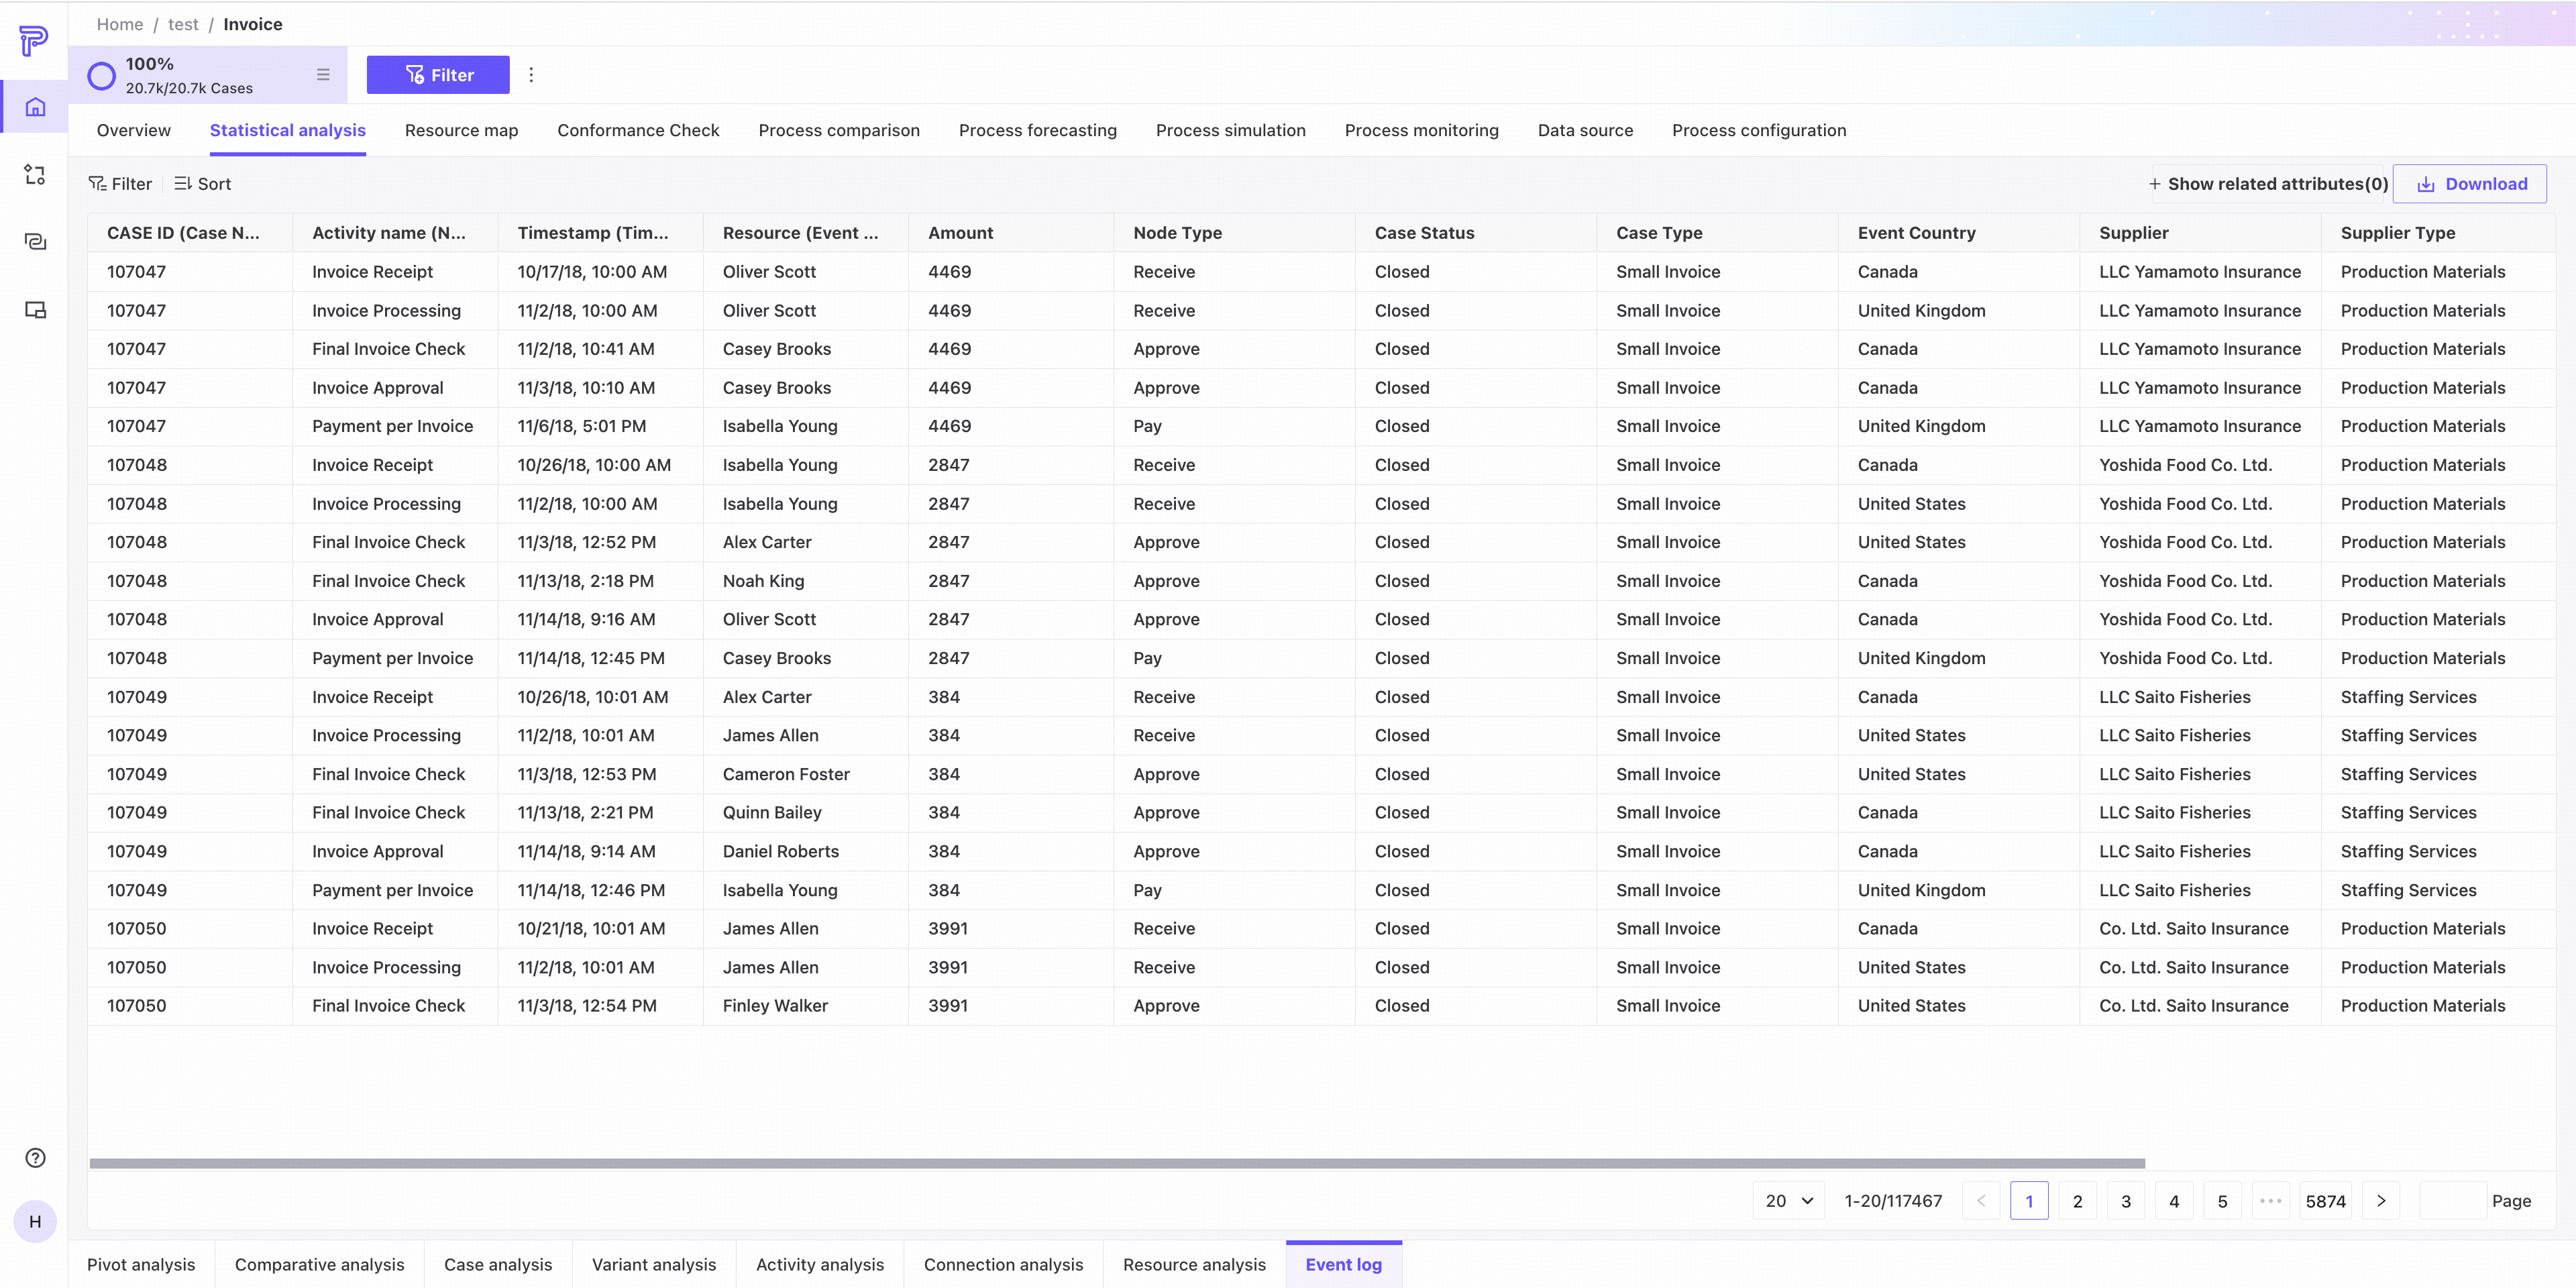
The Event log tab provides only a list view and displays the original log file for the current process analysis.
Common controls
Add filters from table cells
List views across all Statistical analysis perspectives let you quickly add cell values as filter conditions. The following example uses Edge analysis.
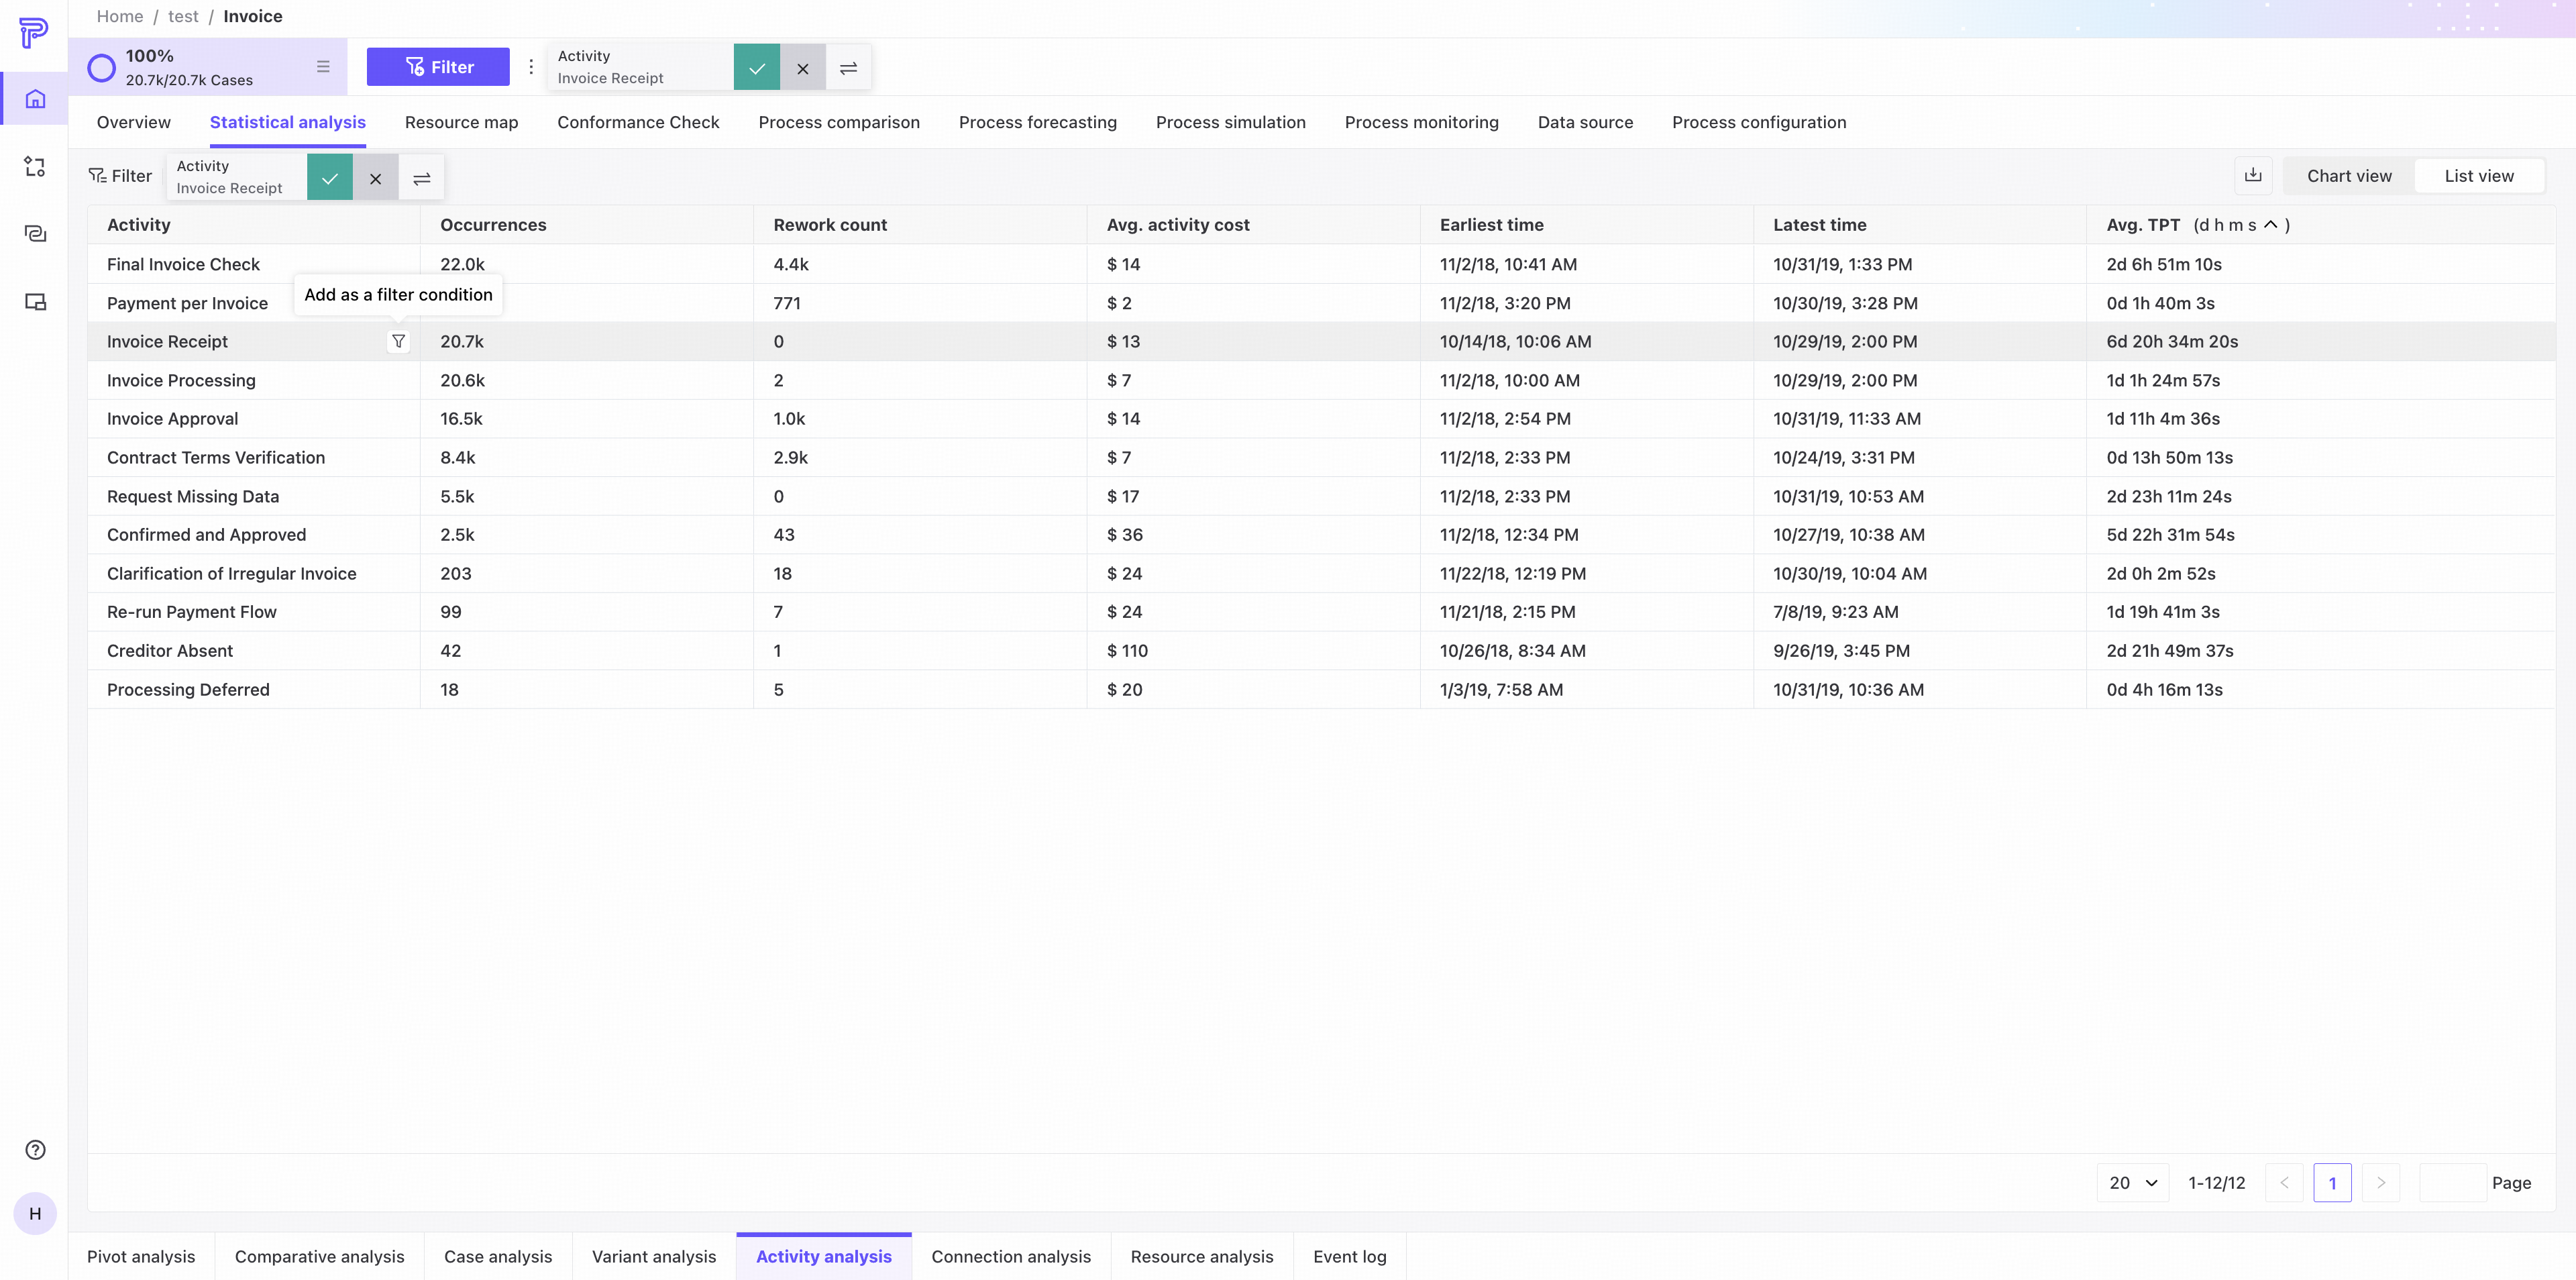
- Hover over a cell to reveal icons for adding its value to list filters or global filters. Some values support list filters only.
- After you click to filter, all rows with the same value in that column are highlighted.
- You can select multiple values in the same column. Clicking another column exits filter mode. In Edge analysis, start and end activities are selected as pairs.
- A popover provides Confirm on the left, Cancel in the middle, and Invert on the right. Select Invert, then Confirm to display the inverse selection.
Filters and downloads
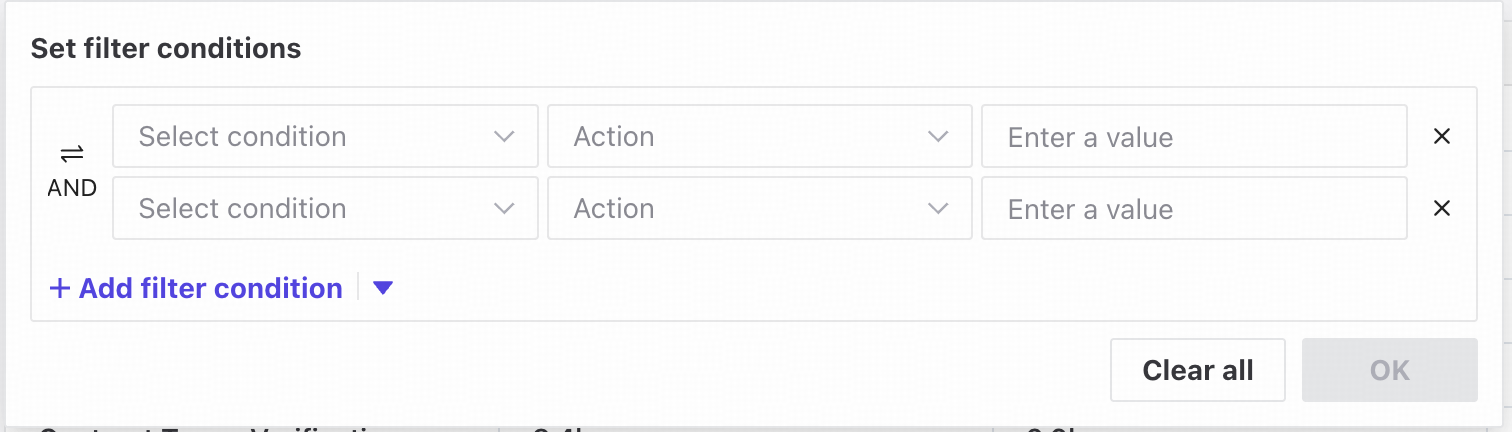
❶ Combine groups of filter conditions using Match all or Match any.
❷ Filter lists using their available columns.
❸ Download the filtered event log, case, variant, or activity data.
Sorting and pagination
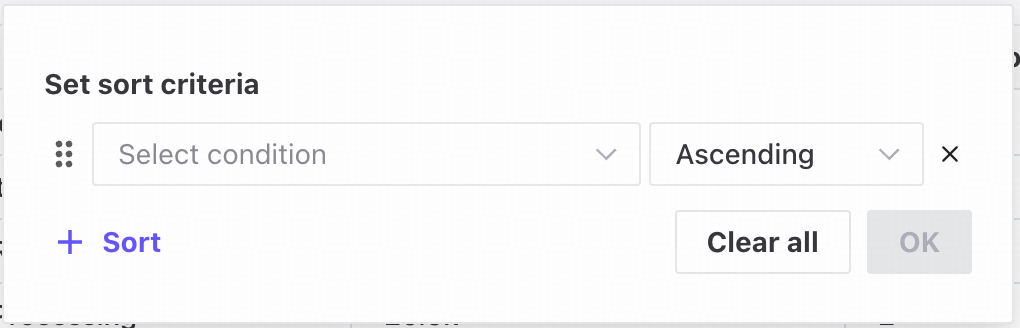
❶ Sort lists by available columns in ascending or descending order.
❷ Drag the handle up or down to reorder sorting conditions.
❸ Set the number of entries displayed per page.