Process map
Overview
A process map visualizes the sequence of events in the data. It arranges activities chronologically and shows all variants from process start to finish, helping you understand the current process.
Features
Process map
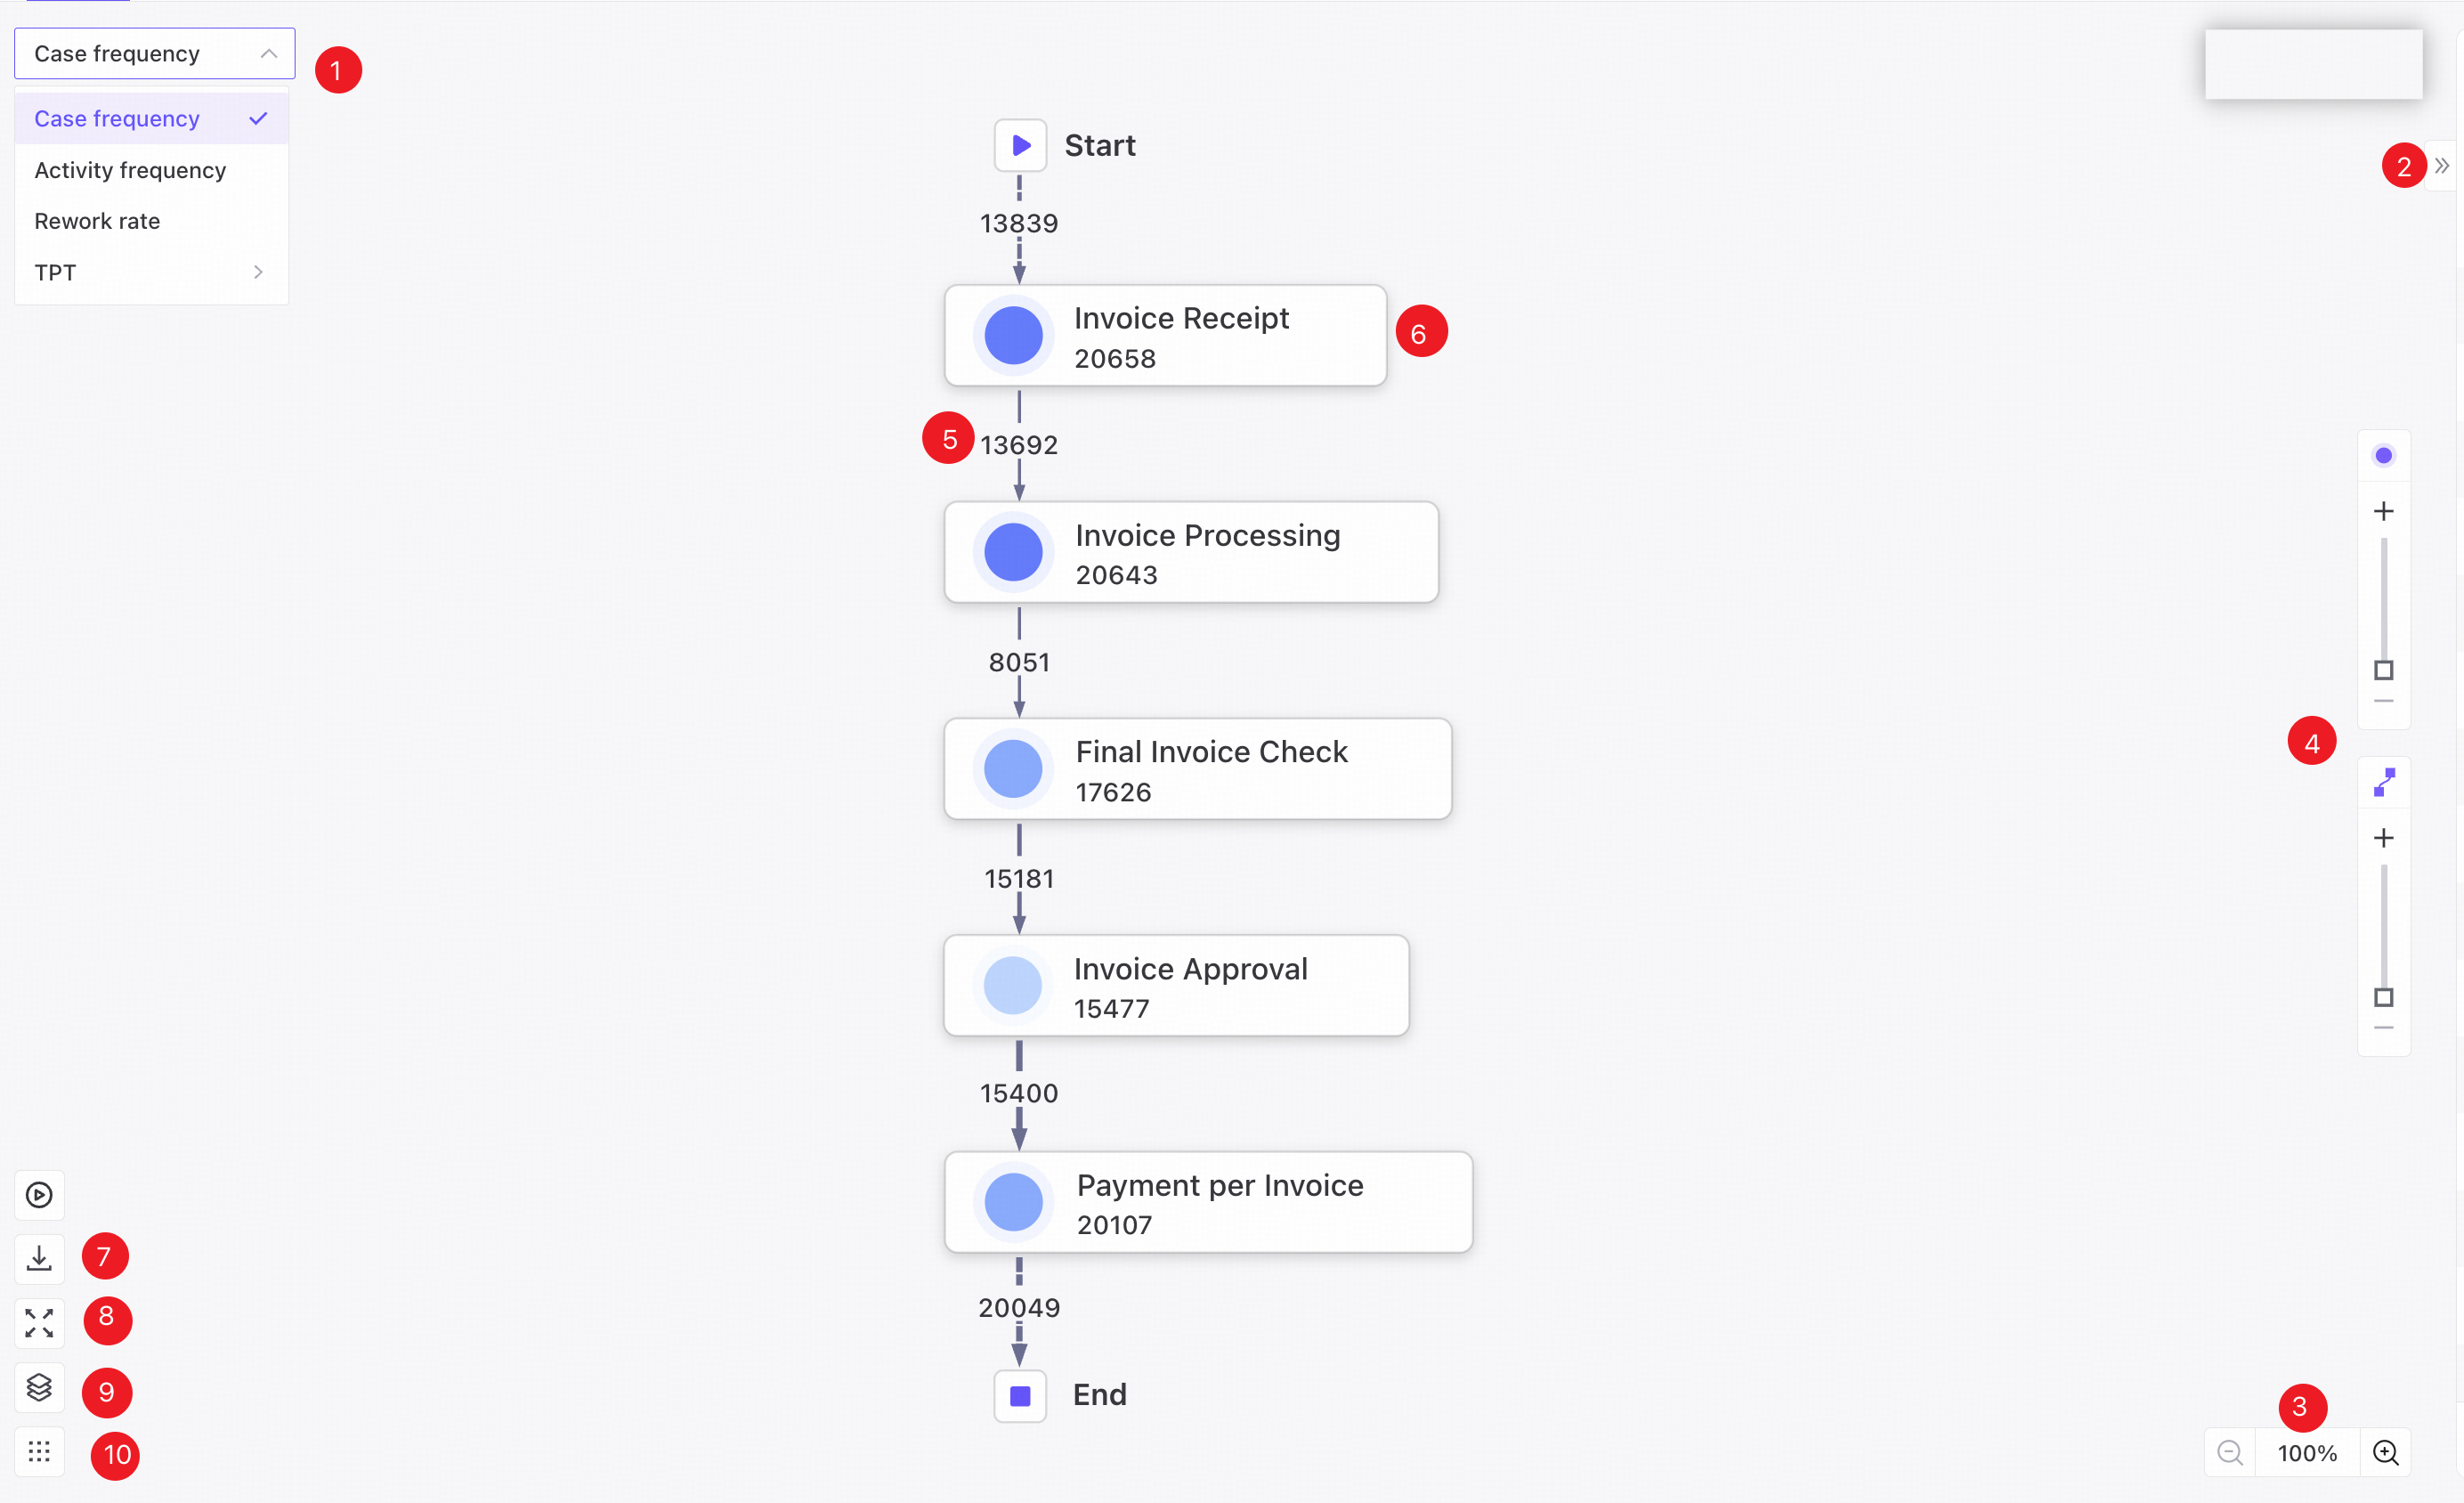
❶ Switch KPIs to display the process map from the corresponding analytical perspective.
❷ Collapse the table area on the right.
❸ Zoom in or out on the process map.
❹ Remove or add activity nodes and connections.
❺ Click an activity node to filter cases that pass through it, do not pass through it, start with it, or end with it.
❻ Click a connection to include or exclude it. Filtering with the dashed connections to the start and end nodes selects cases that start or end with the connected activity.
❼ Download the current process map as an SVG file.
❽ Display the current process map in full screen.
❾ Show the legend.
❿ Show or hide the background.
[Start] and [End] are not actual process activities. They mark the beginning and end of the process map. Dashed connections link them to activities that start or end the process.
The happy path is the most frequently occurring variant in the current process.
Play animation
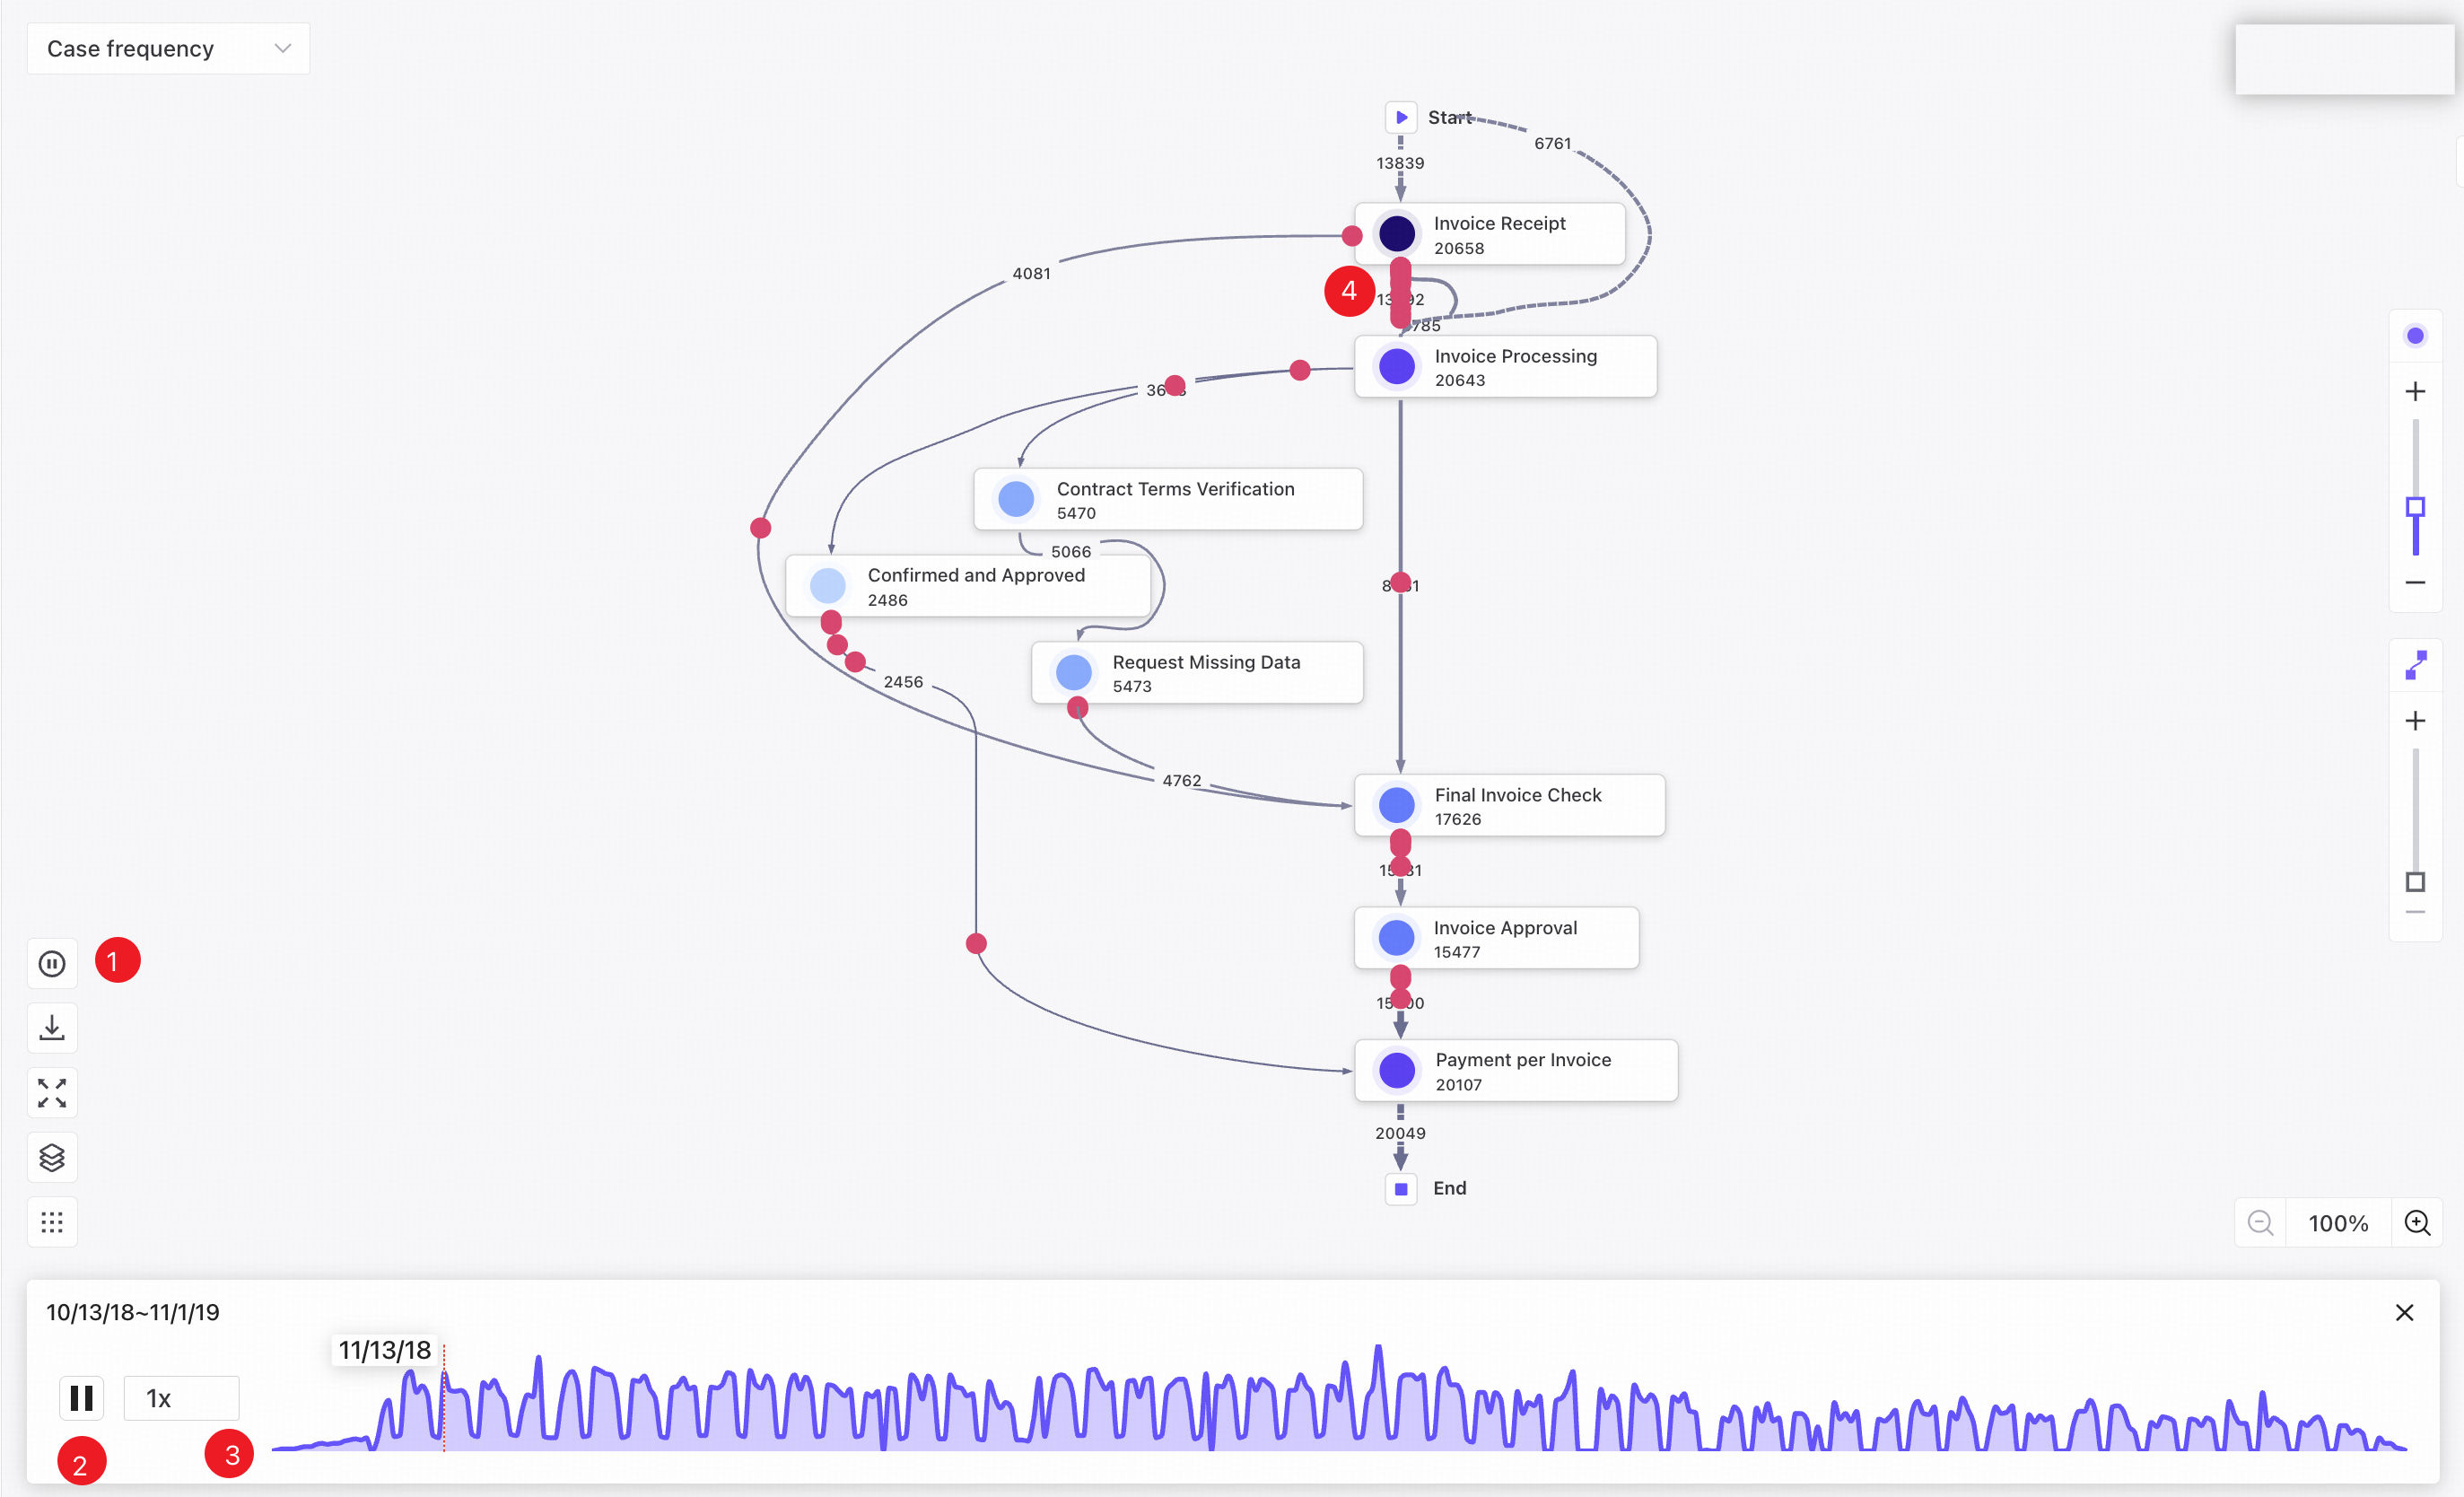
Start the process animation in the lower-left corner of the process map. You can:
❶ Show or hide the process animation view.
❷ Pause or resume the animation and adjust its playback speed.
❸ Drag the playhead to a position within the time range.
❹ Cases appear as red bubbles and move according to their throughput times.
Node details
Click a node in the process map to open a popover with its details.
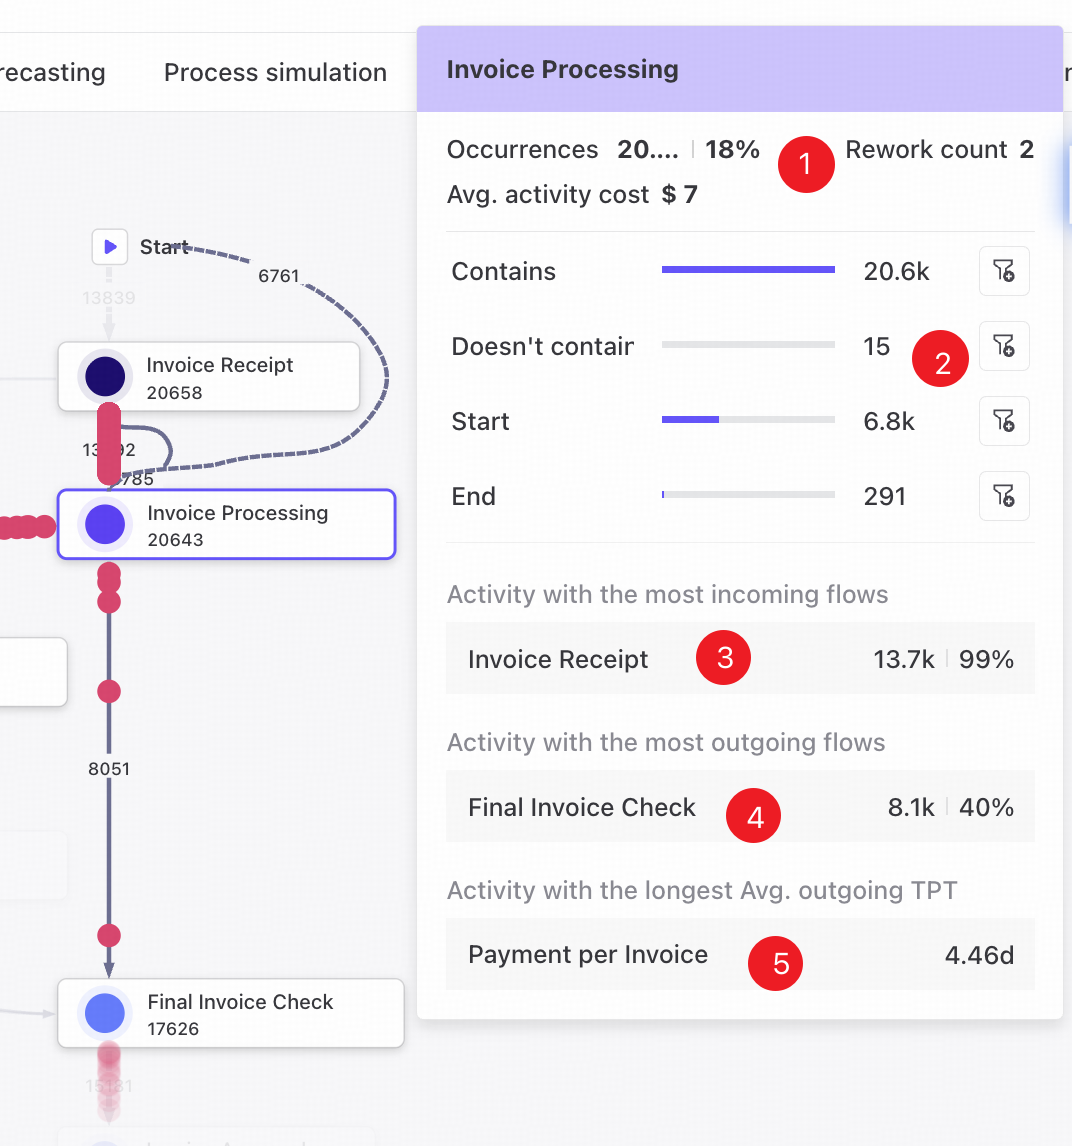
❶ View basic node information: rework count, total occurrences, cases including or excluding the node, and cases starting or ending with it.
❷ Click to add the condition directly to the filters.
❸ The activity with the most transitions into this node.
❹ The next activity with the most transitions out of this node.
❺ The next activity with the longest average throughput time from this node.
Connection details
Click a connection between two nodes to open a popover with its details.
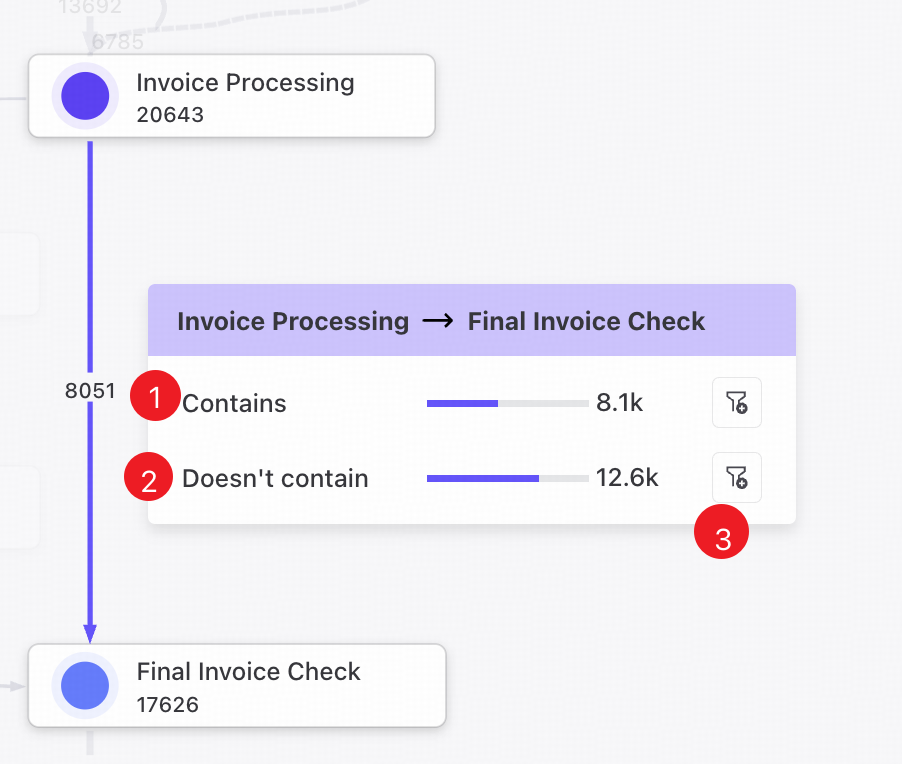
❶ The number of cases that include this step.
❷ The number of cases that do not include this step.
❸ Click to add the condition directly to the filters.
Variants tab
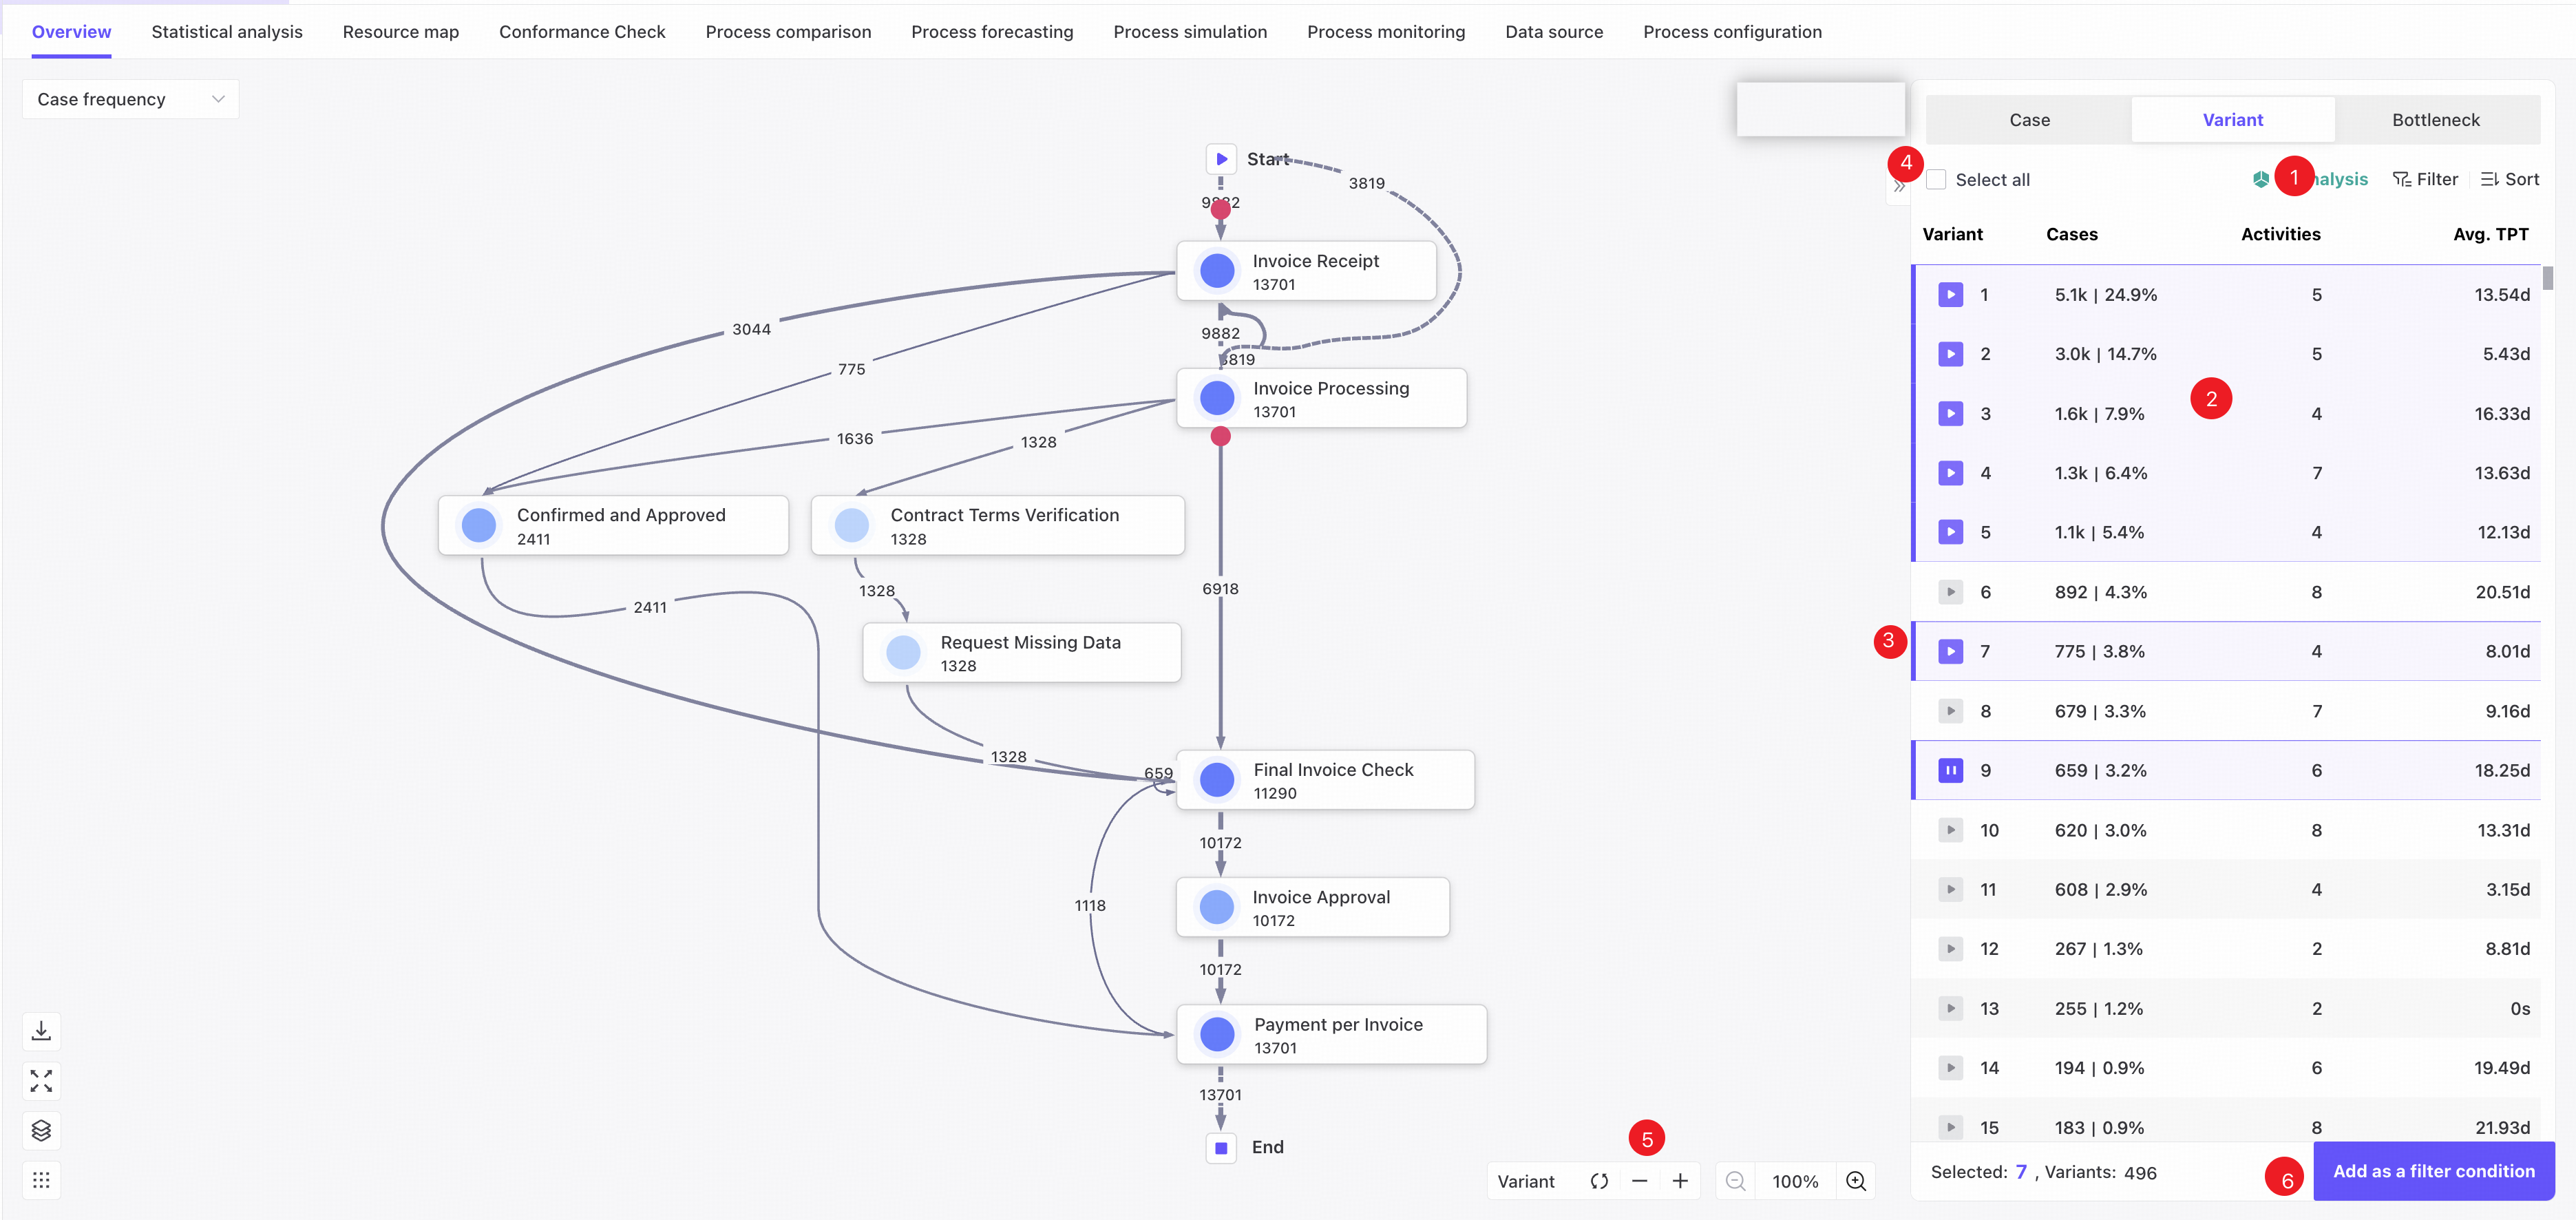
❶ Filter or sort the variants displayed in this panel. For details, see Variant list.
❷ Click a variant to add it to the process map on the left and highlight it. Multiple variants can be selected.
The most frequently occurring variant is selected by default.
❸ Click Play to animate the cases in the variant as moving red bubbles. Only one variant can be played at a time.
❹ Select or deselect all variants.
❺ Click + or - to add or remove one selected variant. Click Reset to select the happy path by default.
❻ Click to add the selected variants as filter conditions. For details, see Variant filtering.
A variant is an end-to-end sequence of process activities. Each case follows exactly one variant.
Cases tab
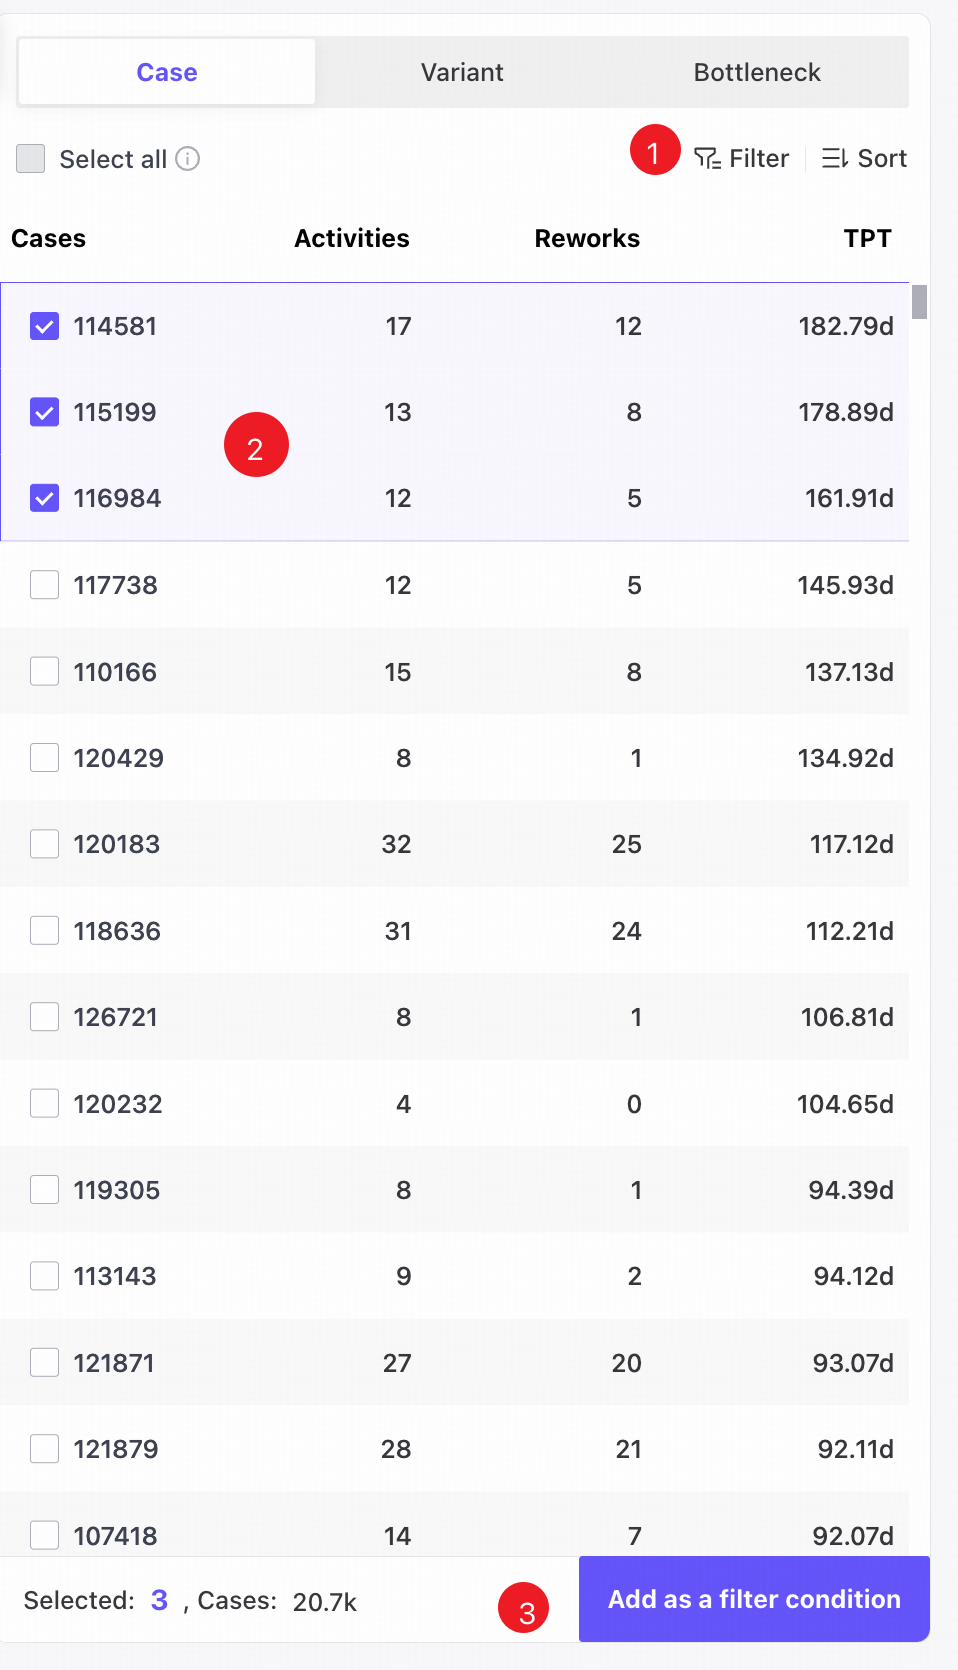
❶ Search and sort the current Case ID data. For details, see Case list.
❷ Select case checkboxes to display their process flows on the map on the left. Multiple cases can be selected.
❸ Filter the currently visible cases.
Bottlenecks
Bottleneck analysis examines the entire process to locate steps that restrict efficiency. Measures such as activity throughput time and the percentage of cases help identify which activities are bottlenecks.
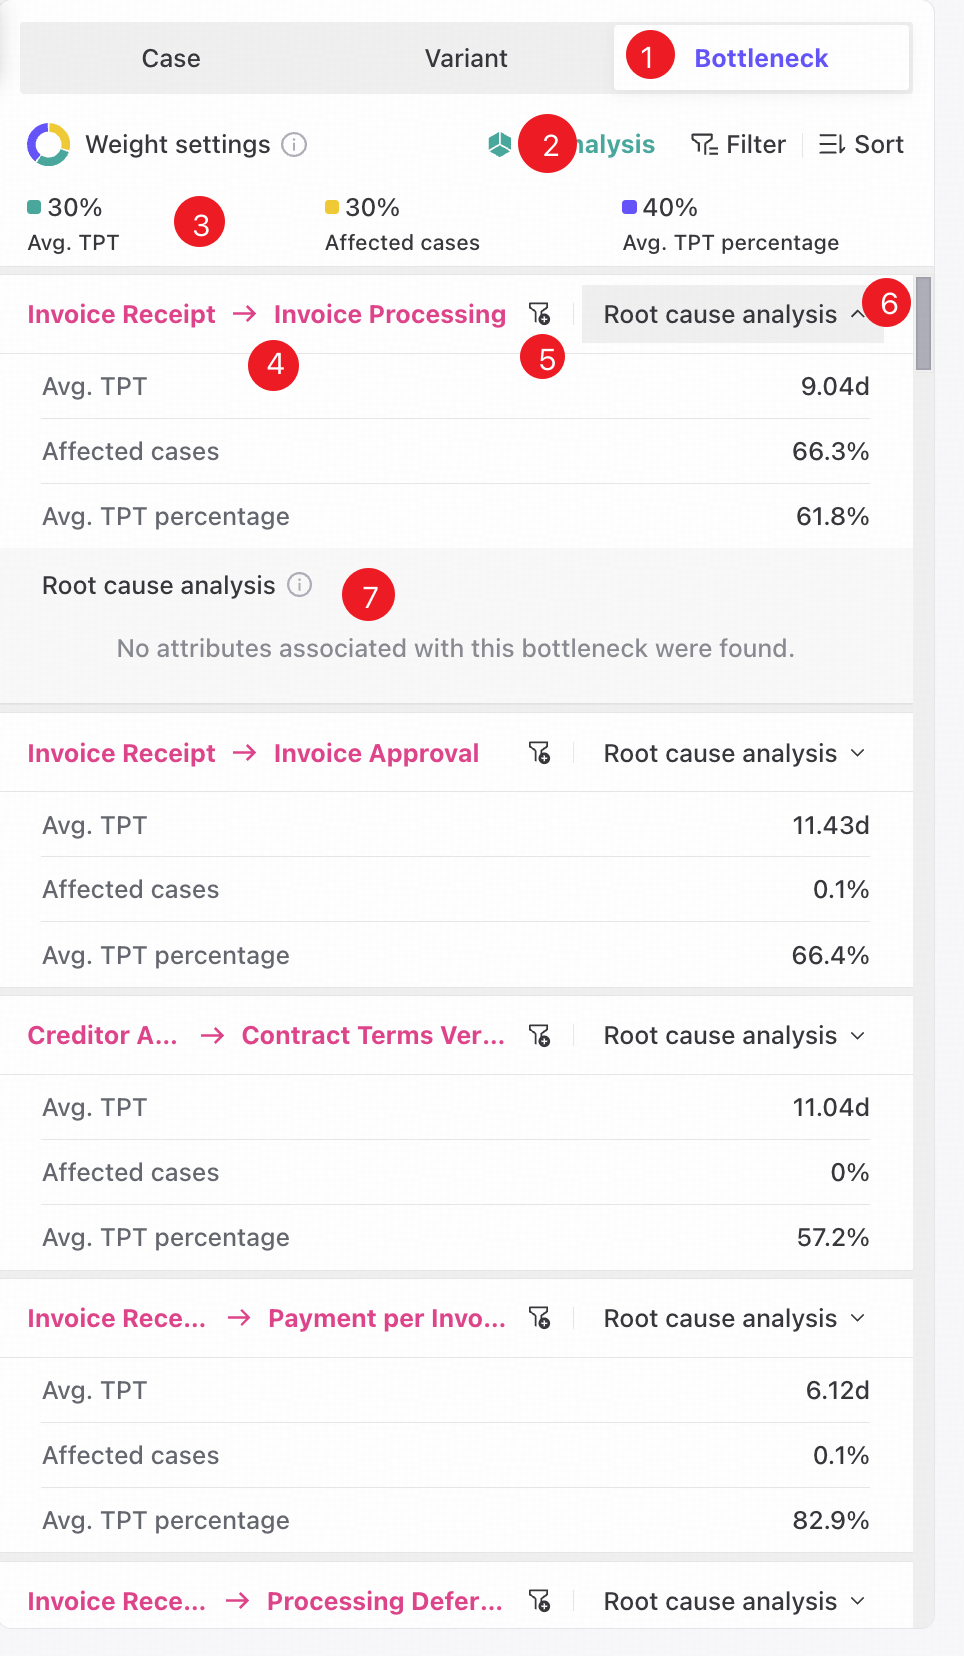
❶ Open the Bottlenecks tab.
❷ Filter by activity and other criteria.
❸ View the weights configured in Bottleneck analysis settings. The algorithm uses these weights in its calculations.
❹ The step corresponding to the bottleneck edge.
❺ Add the bottleneck edge as a filter condition.
❻ Expand the Root cause analysis results.
❼ Using Root cause analysis settings, evaluate how different attributes affect throughput time. Results show each attribute's contribution and actual case count, with up to five key attributes displayed.
If no root cause attributes are identified in the configured attribute columns, the screen displays “No attributes associated with the bottleneck were found.”
Display limits
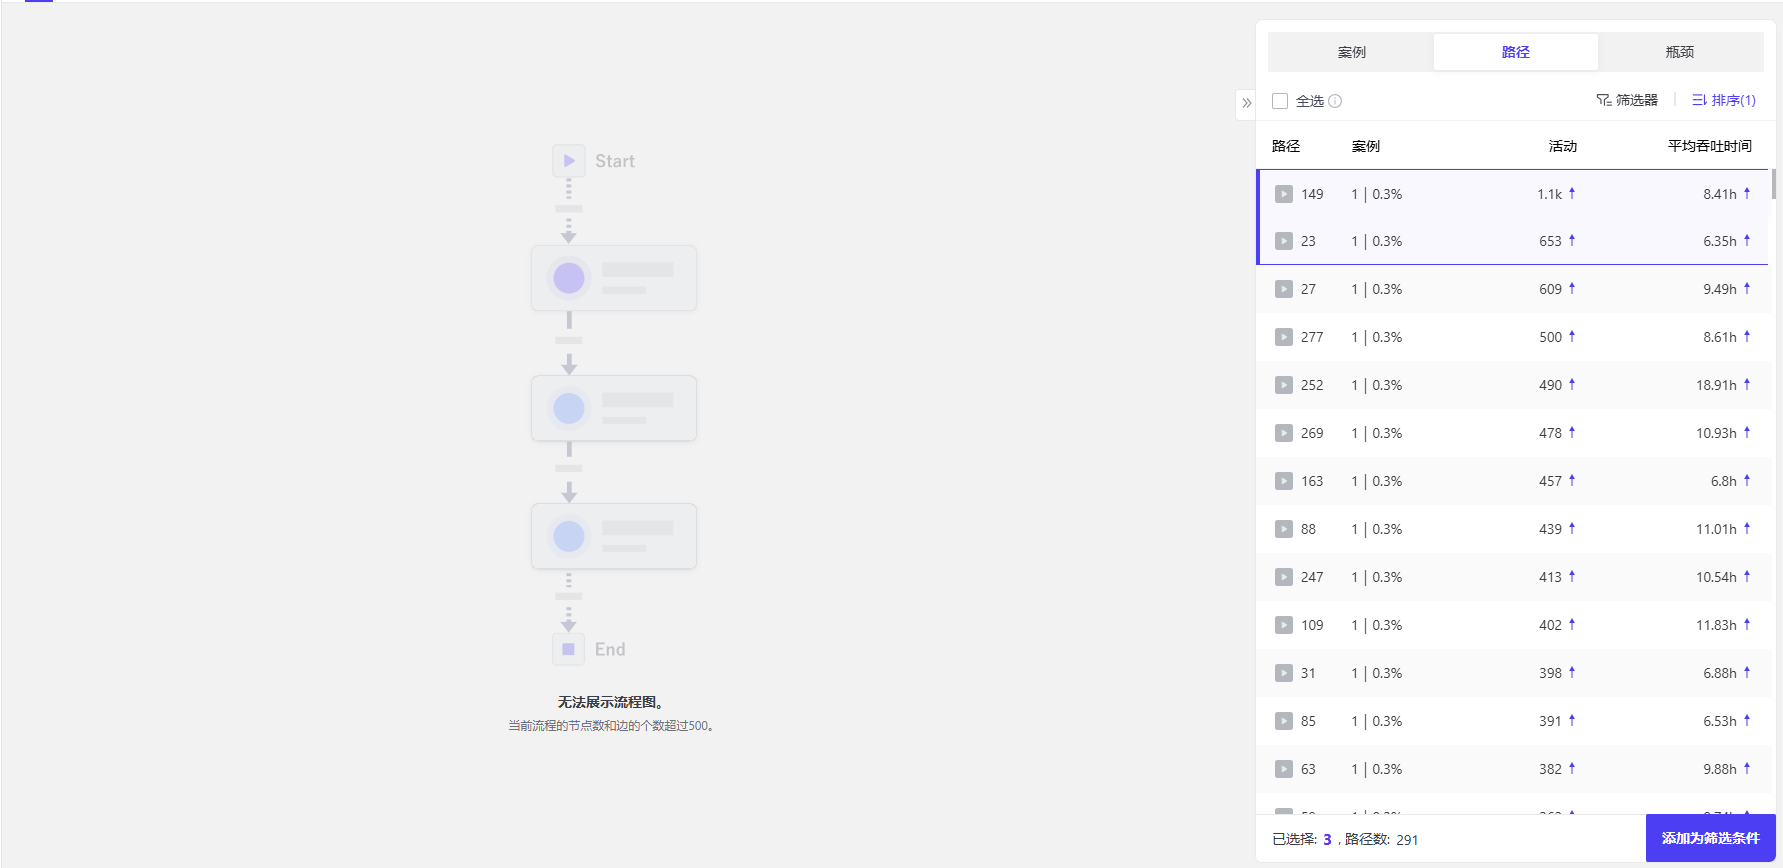
Unable to display
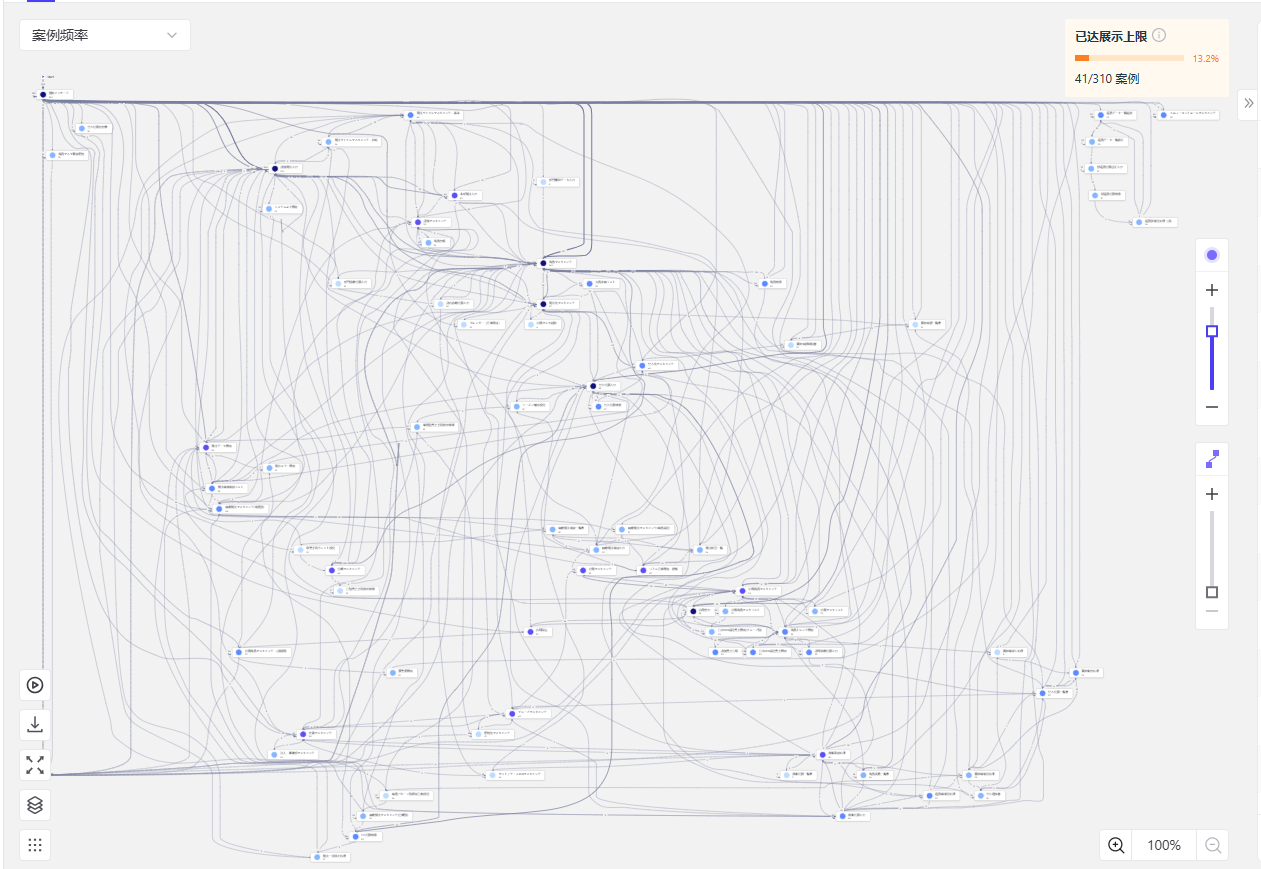
The process map cannot be displayed when the default happy path or selected variants contain more than 500 nodes and edges.
Partial display
When increasing complexity with the slider causes the node and edge count to exceed 500, only part of the process is displayed. The upper-right corner shows the percentage of cases represented by the current map.