Conformance Check
Overview
Conformance Check compares the actual business process recorded in the event log with a process model. It can also help validate the model. When deviations are found, you can correct the model or investigate anomalies in the log.
- Shows trends in process model conformance.
- Returns differences between the model and actual process as a violation list, helping you assess conformance to the reference model and count cases that follow the intended process.
Features
Prerequisites
Before running Conformance Check, configure and load a business process model for comparison. If no model is loaded, click Go to process configuration to configure one.
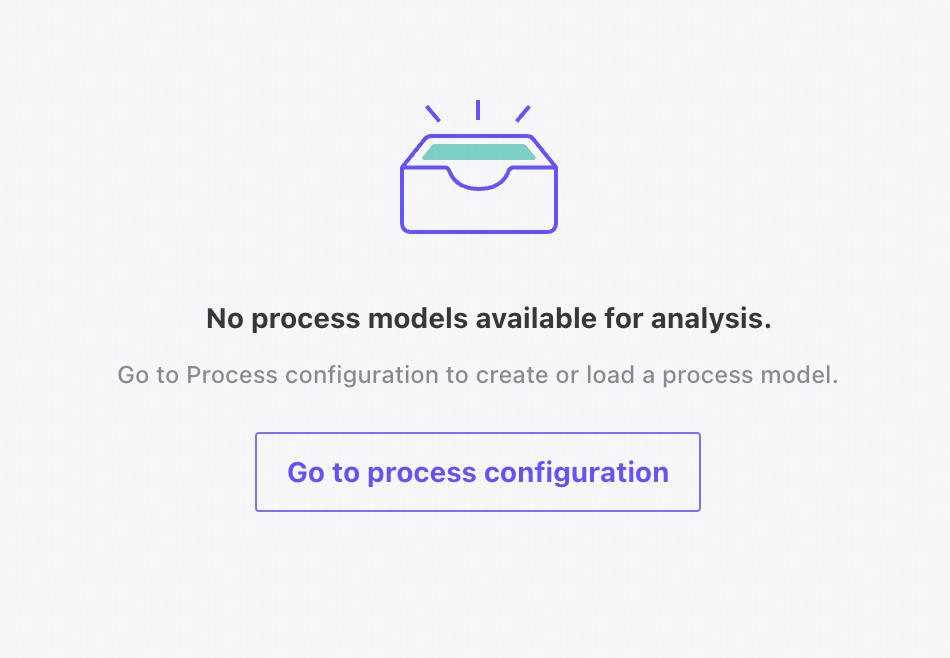
Conformance Check start page
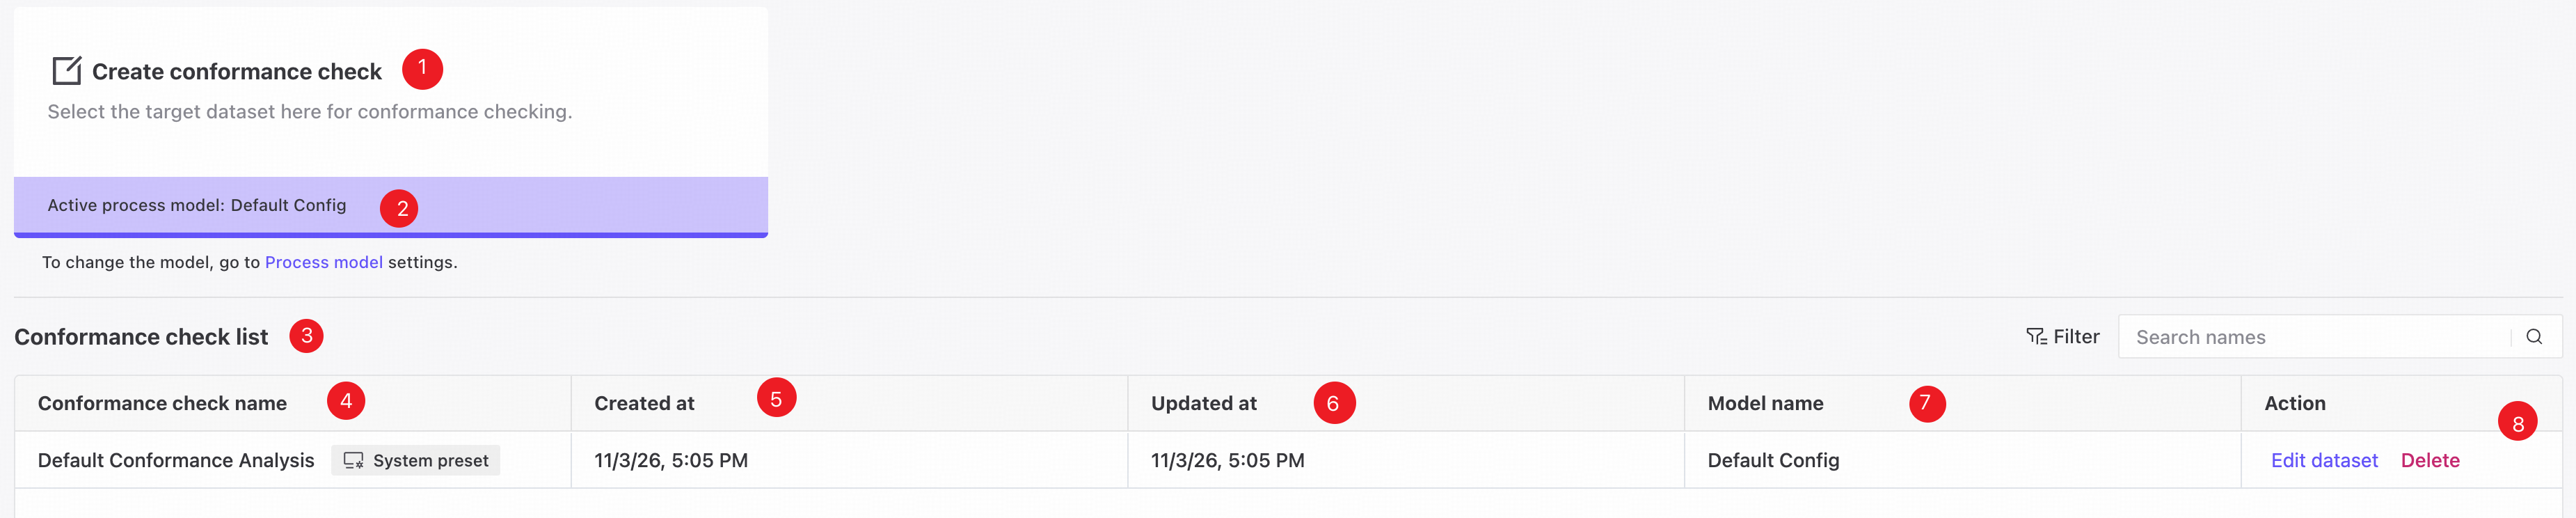
❶ Click the card to create a conformance check.
❷ The process model currently used by this analysis.
❸ Conformance check list.
❹ Conformance check name.
❺ Creation time.
❻ Update time.
❼ The process model used for this conformance check.
❽ Actions: edit or delete the conformance check.
Deleting a process model also deletes its associated conformance checks.
Create a conformance check
Click the Create conformance check card to open the creation page.

❶ Enter a conformance check name.
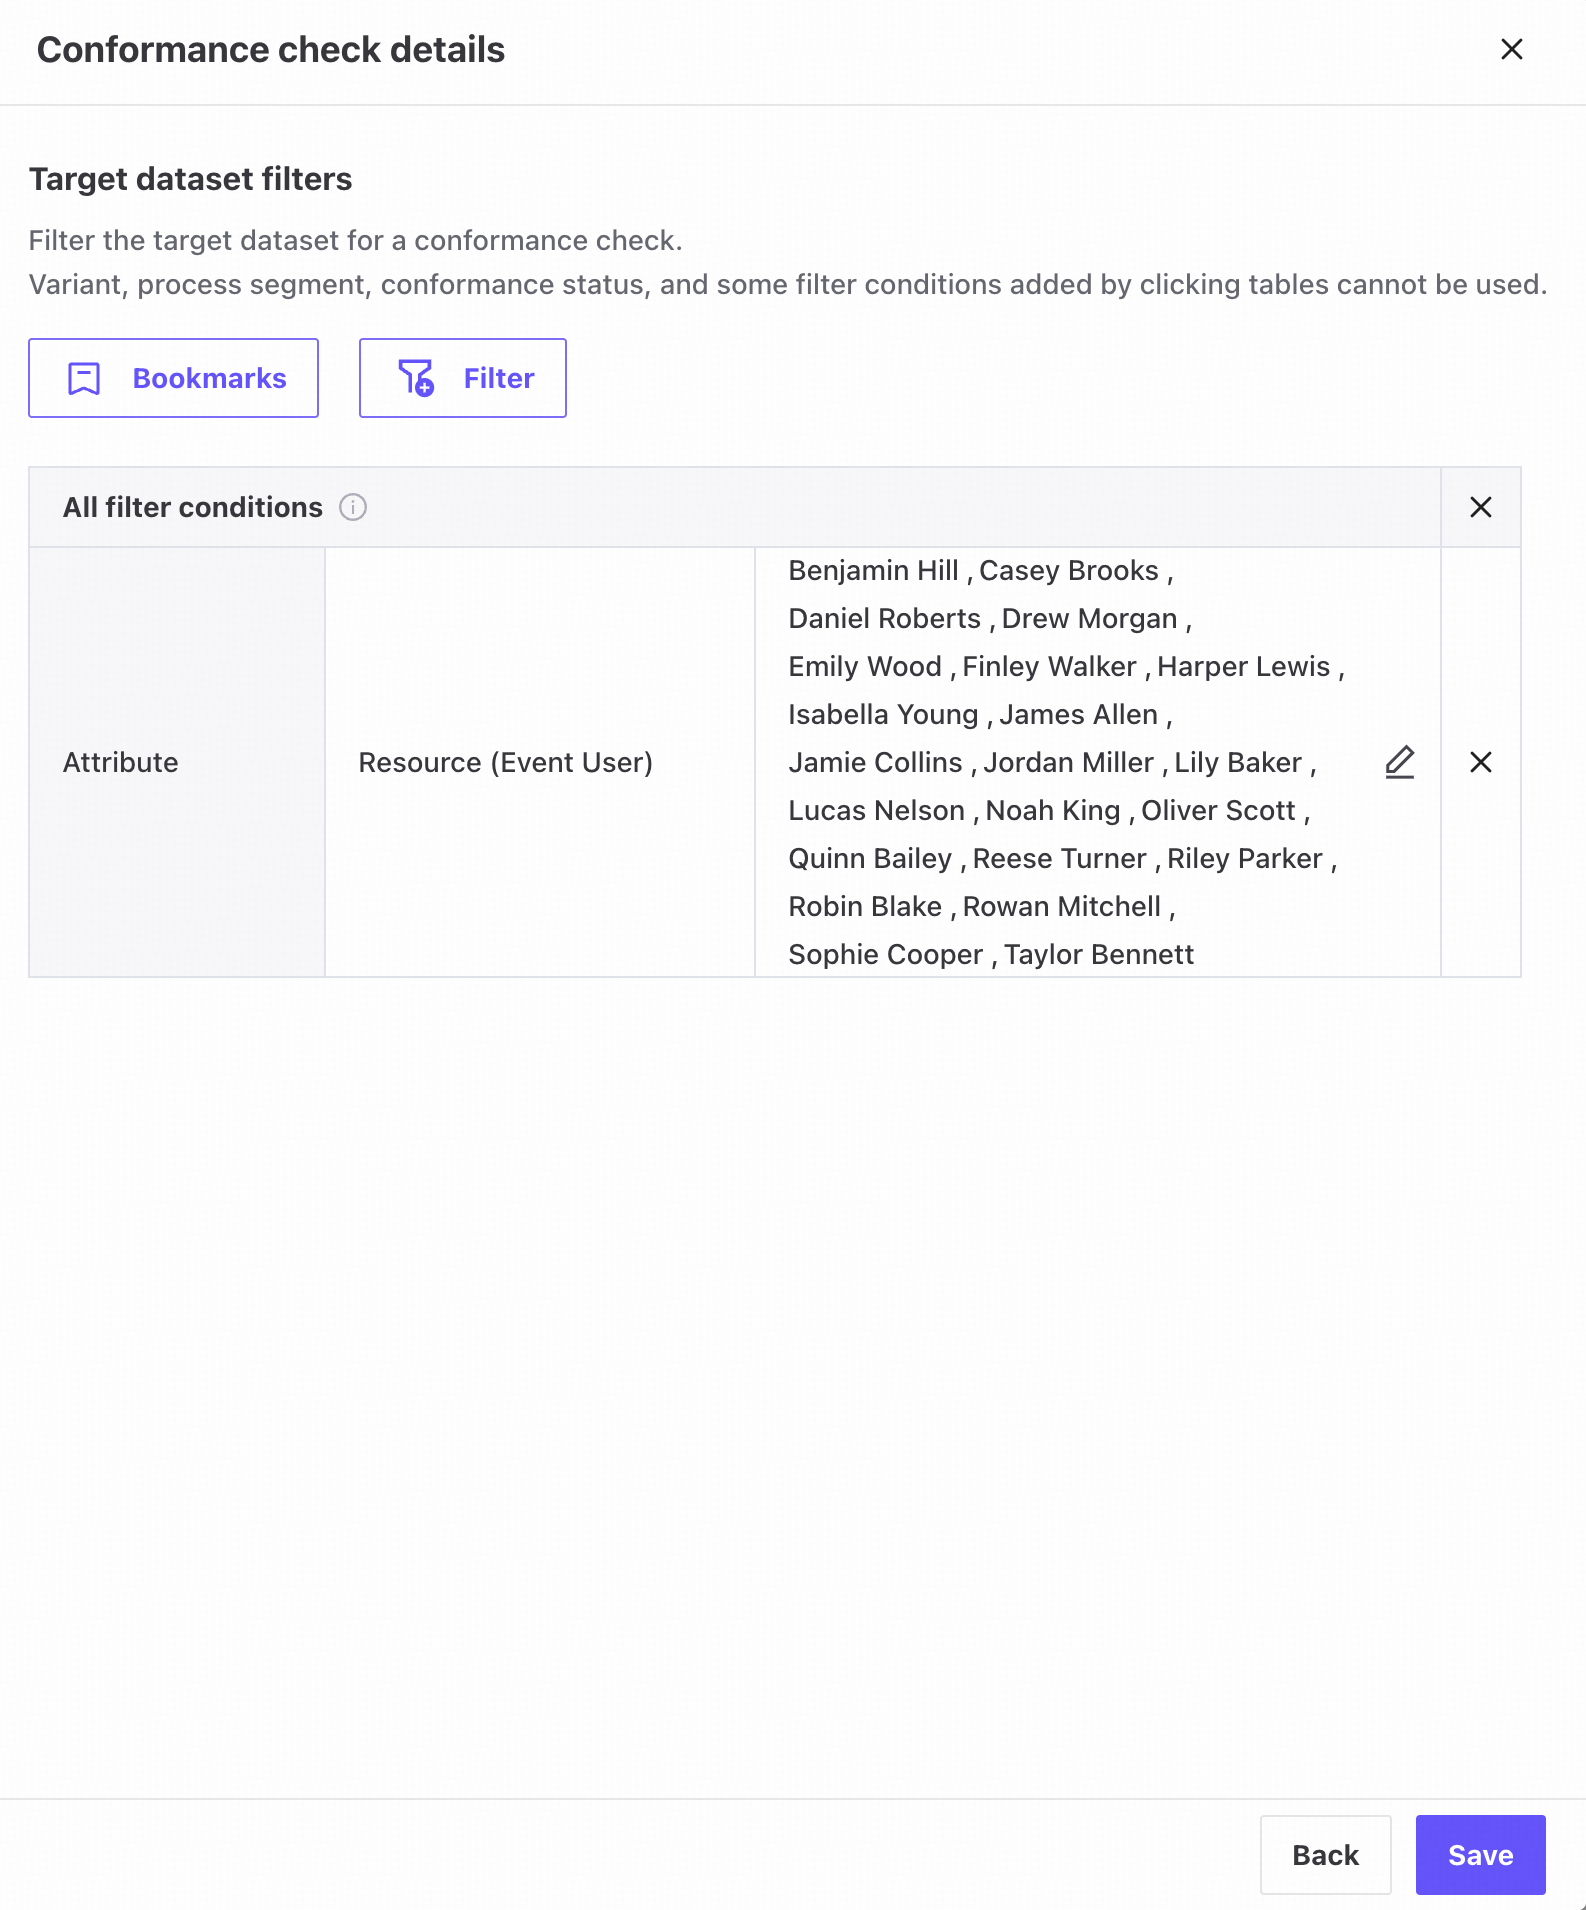
❷ Filter the target dataset. Select an existing bookmark or define filter conditions. For details, see Filters.
You can select bookmarks here, but cannot edit or create them. Results include only the selected dataset.
Conformance overview
The overview displays conformance statistics, KPI comparisons, and differences from the process model identified by the conformance algorithm.
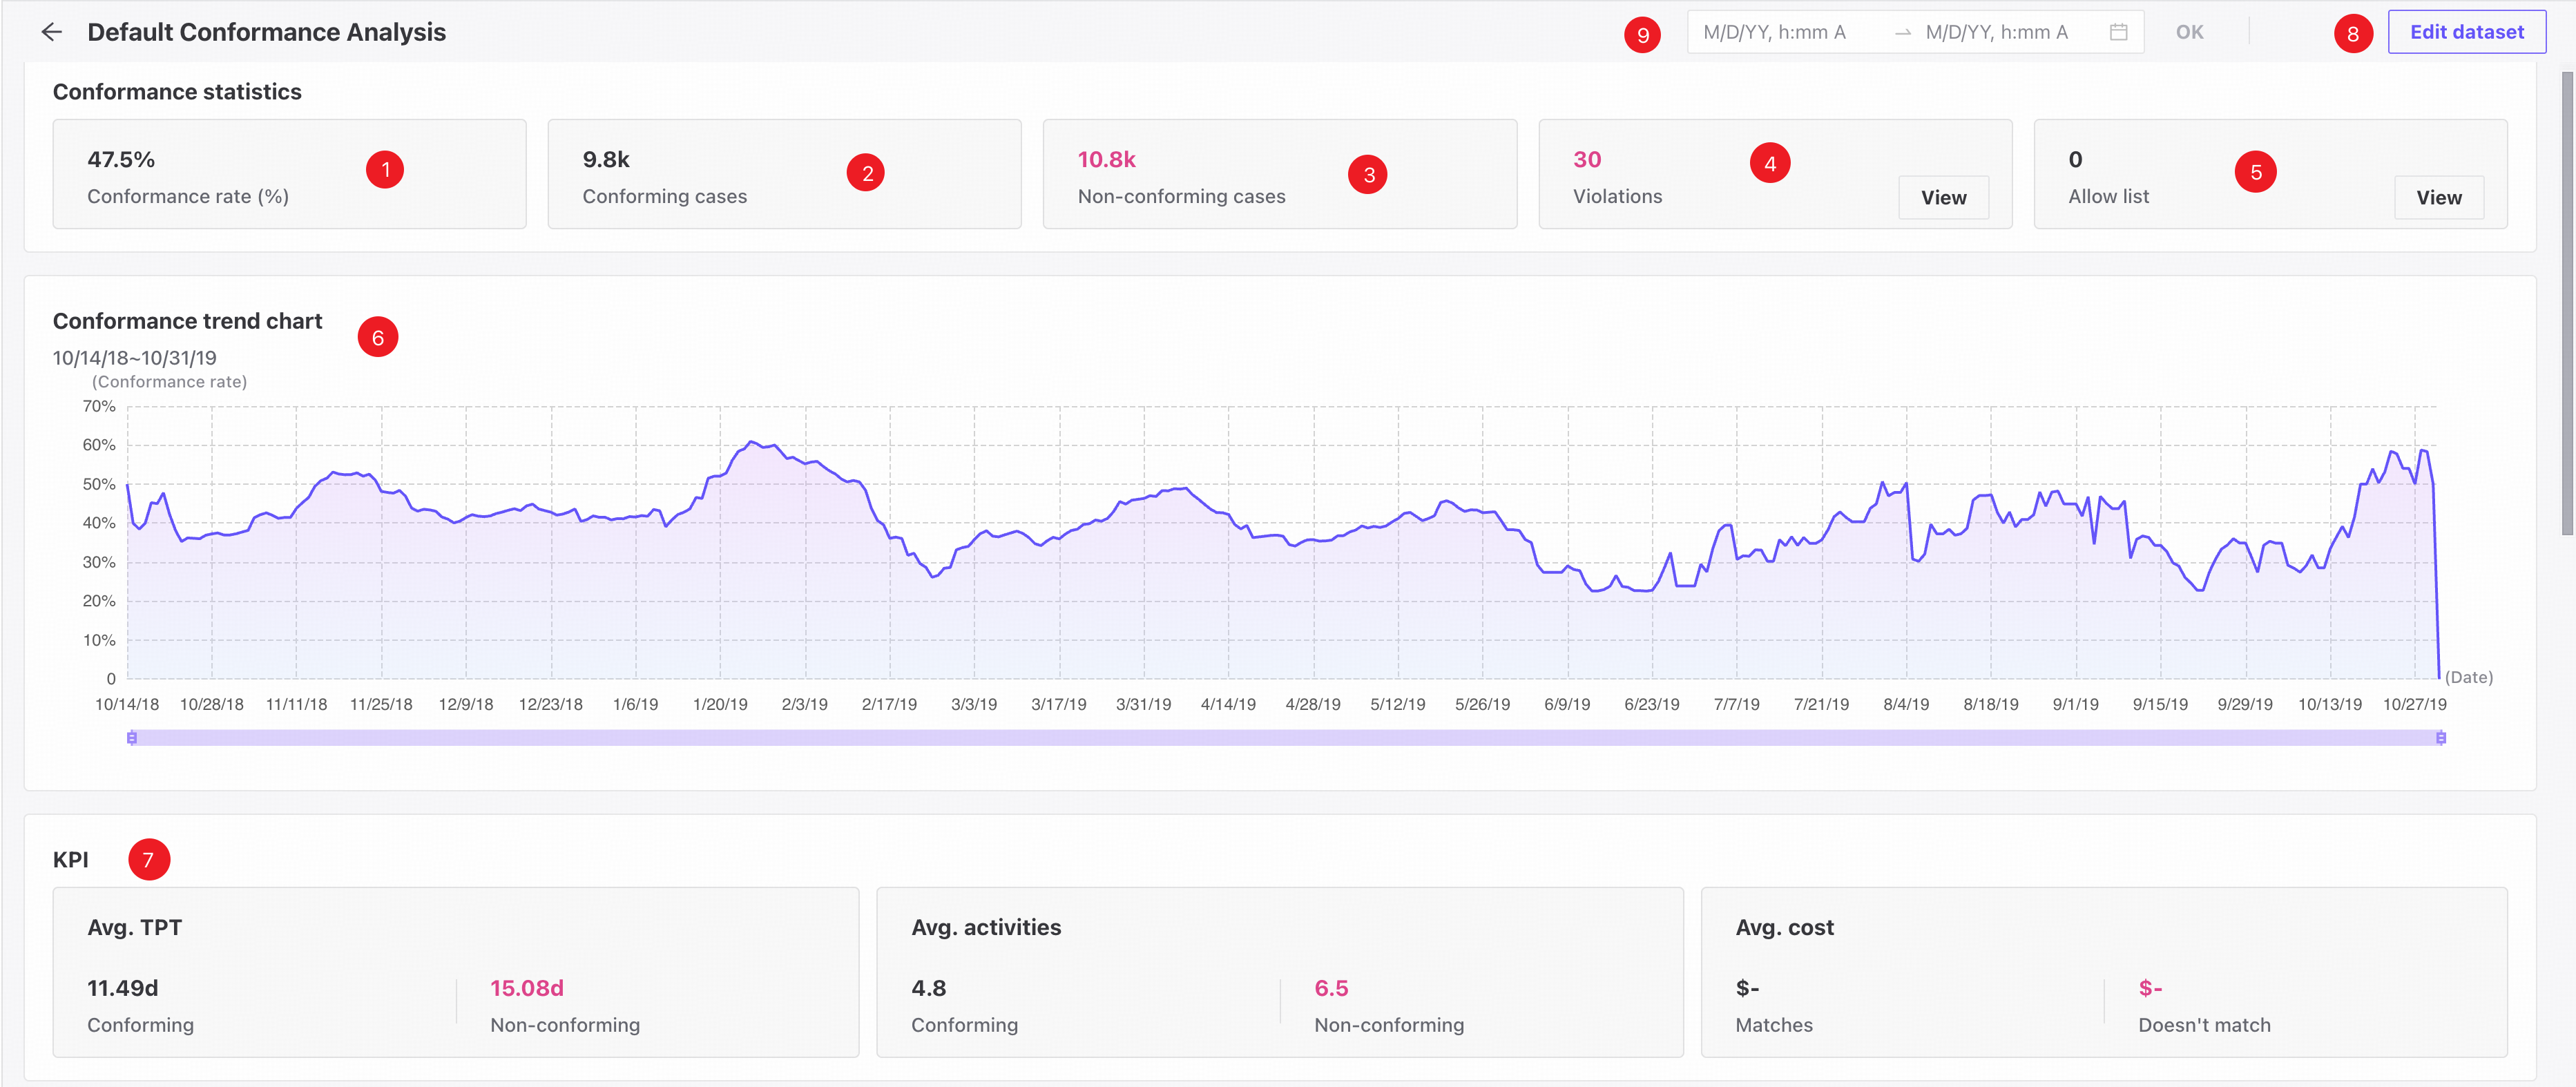
❶ Percentage of cases conforming to the current model.
❷ Number of conforming cases.
❸ Number of nonconforming cases.
❹ Number of identified violations. Click View to open the Violation list panel.
❺ Number of allow list entries for the current model. Click View to open the Allow list tab.
❻ Conformance rate trend over time. Adjust the displayed period using the date selection controls at the top.
❼ KPI comparison between conforming and nonconforming cases. Average case throughput time and average activity count are displayed by default.
❽ Open the dataset editor from the right to change the target dataset.
❾ Select the time range to examine.
Violation details
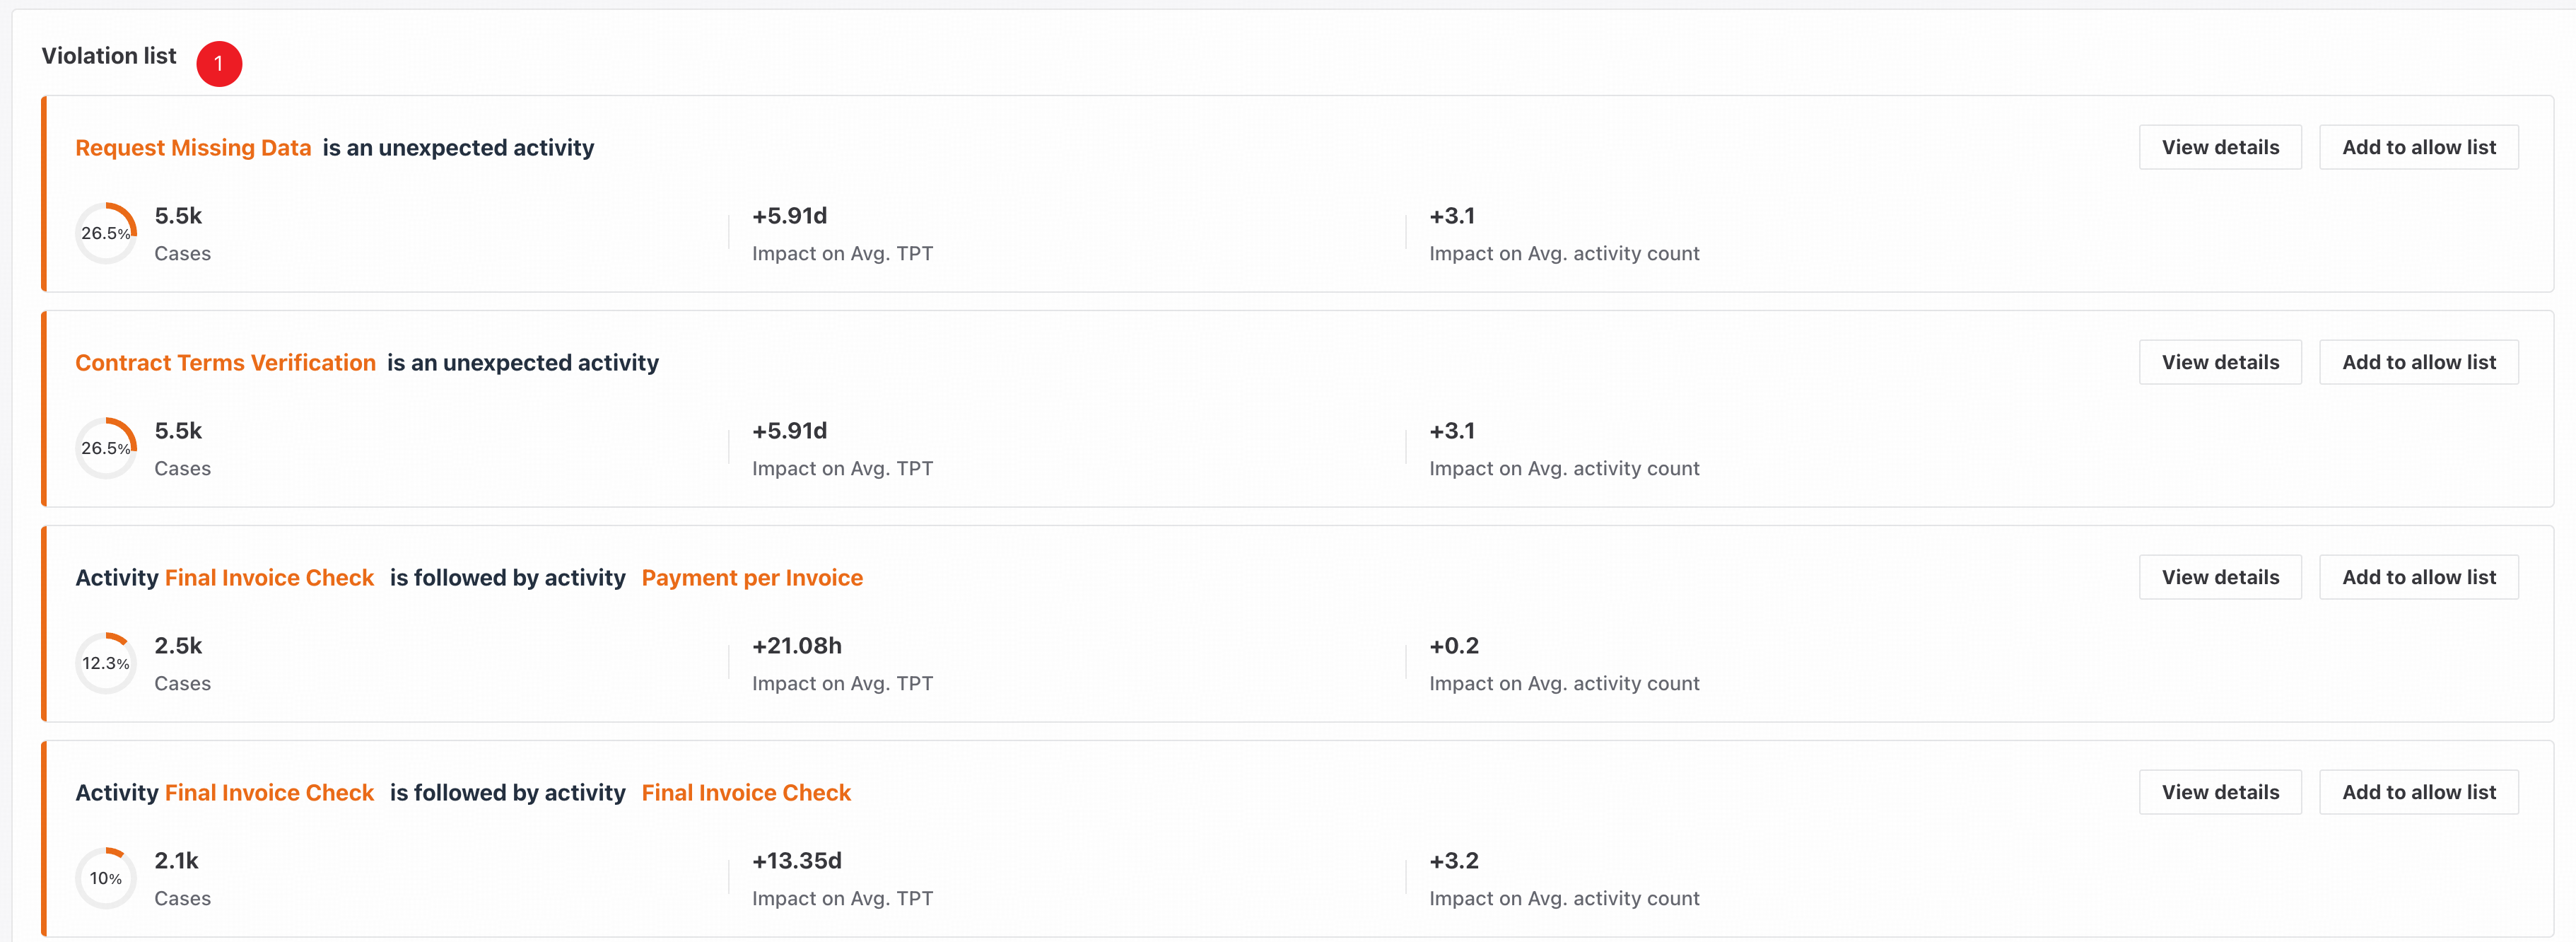
❶ The violation list. Percentages may not total 100% because a case can have multiple violations. For each violation:
- Click Add to allow list to move the violation out of the violation list and recalculate overview statistics.
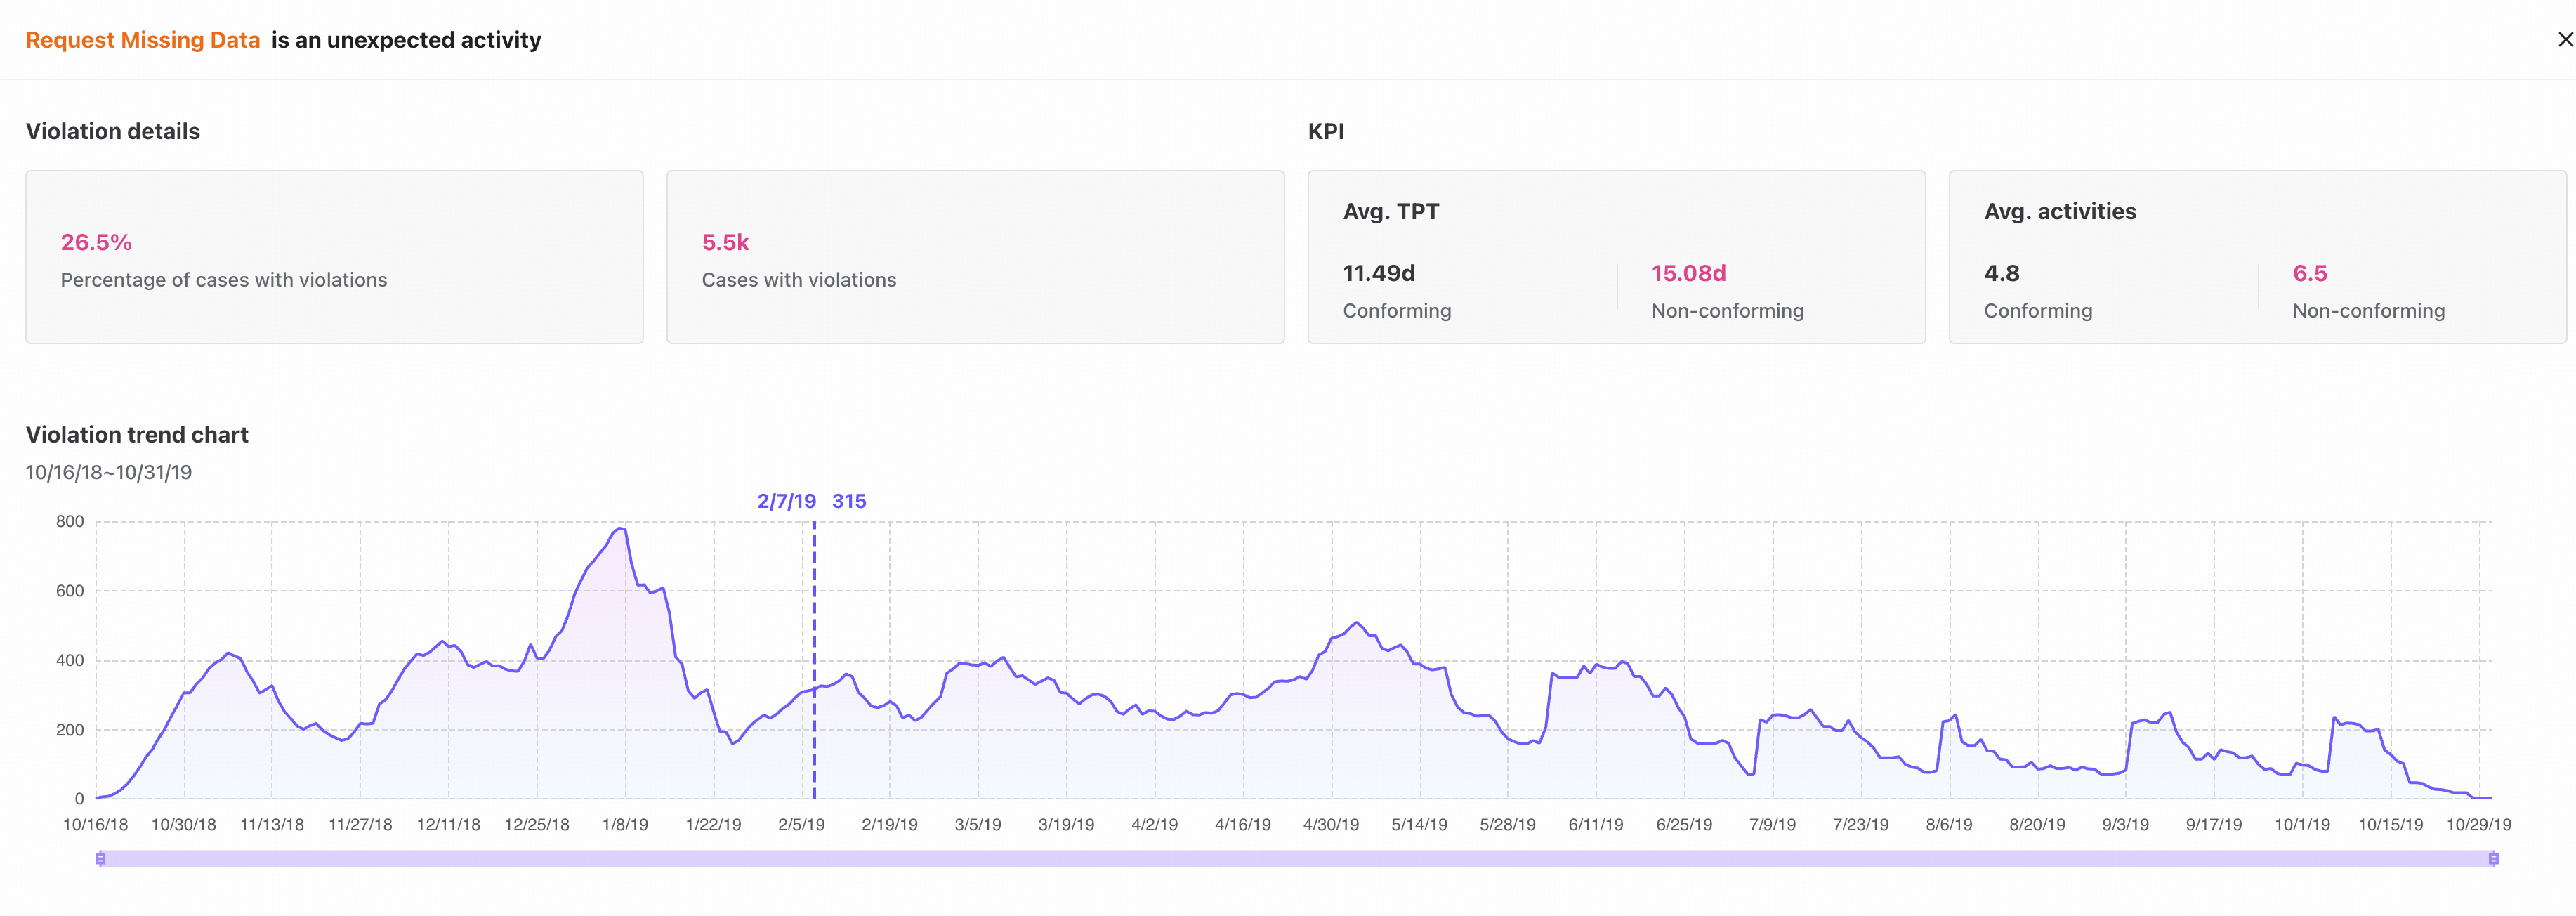
- Click View details to inspect the violation. The analysis is filtered to cases with that violation so you can investigate it further.
Root cause analysis
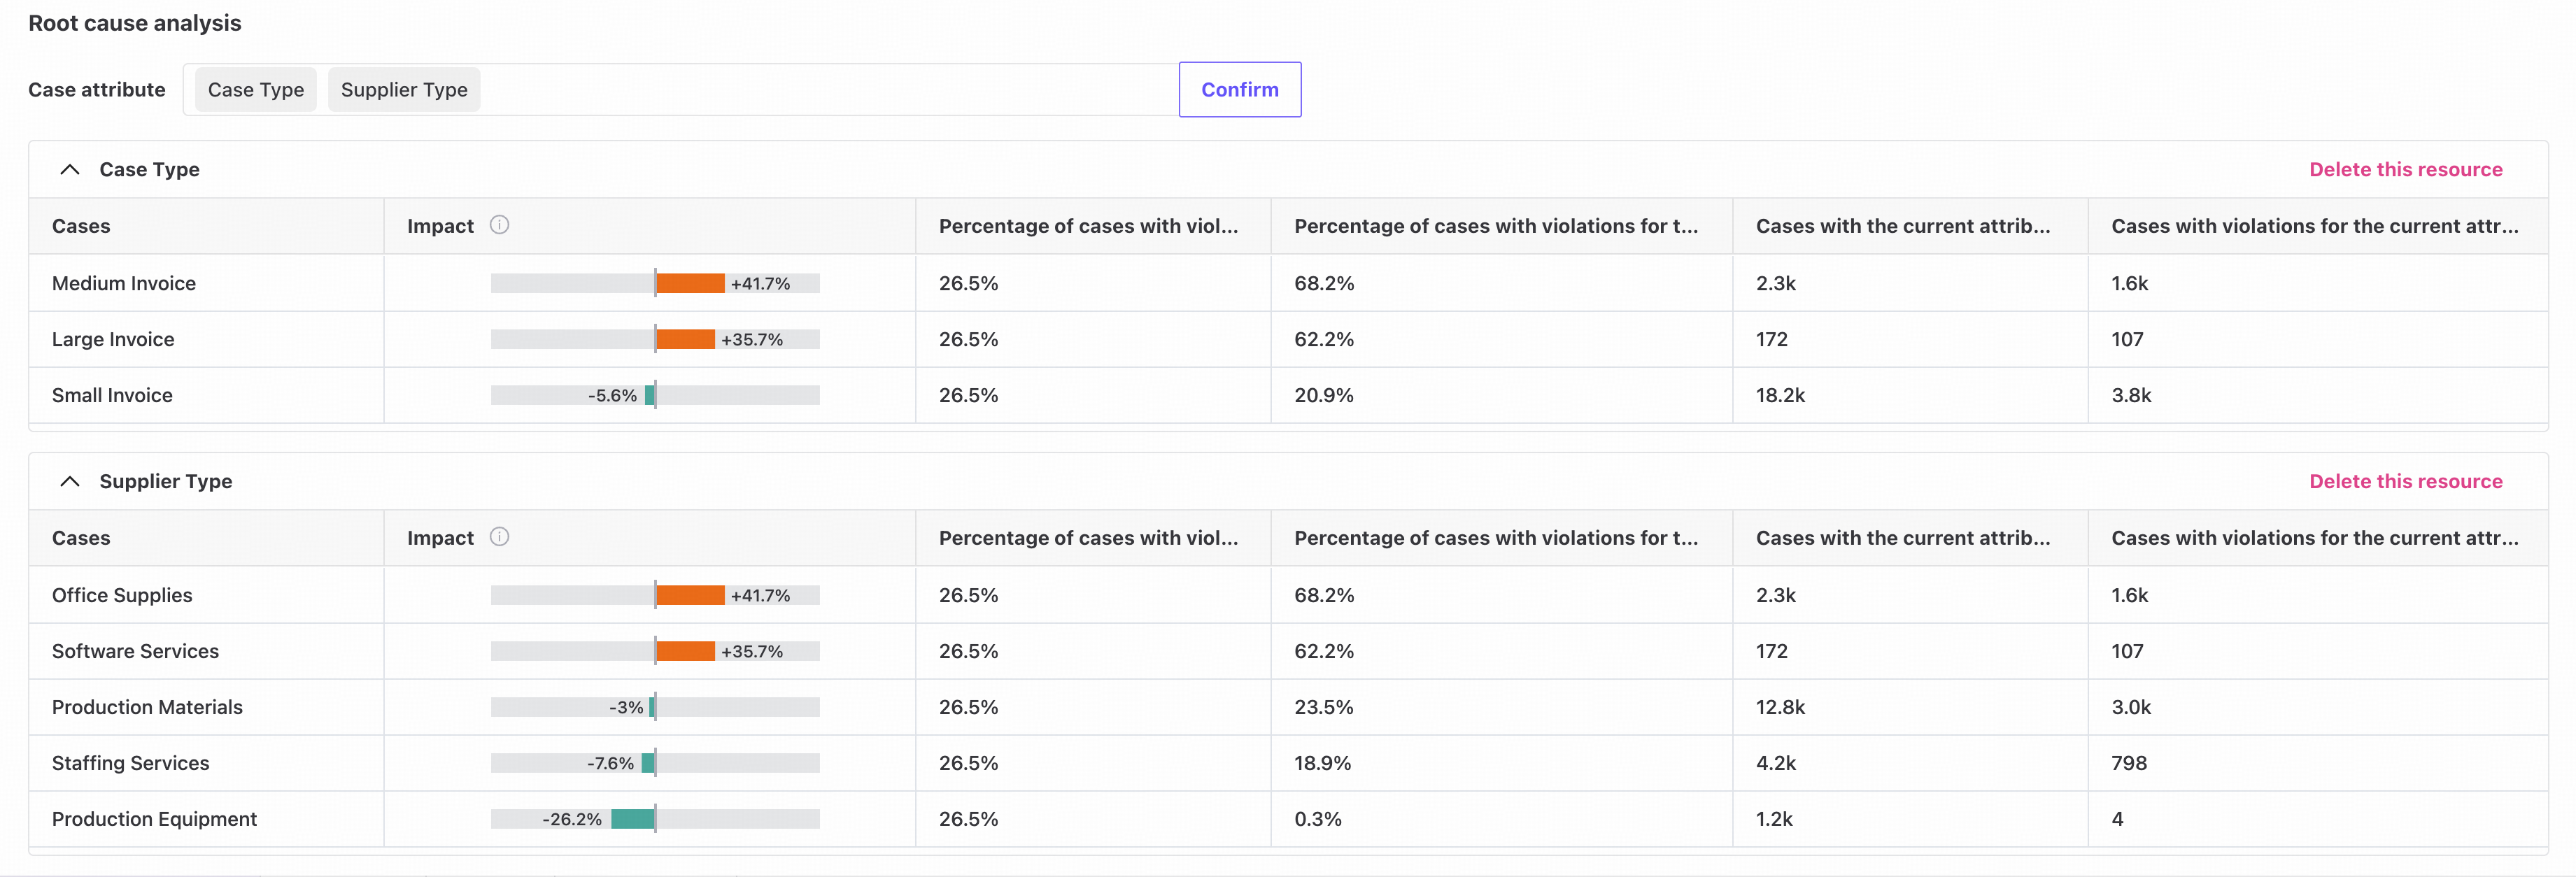
- Root cause analysis identifies underlying causes of process delays and inefficiency. By analyzing case attributes and their effects, it supports targeted improvements and better overall operating efficiency.
- Impact is the deviation from the reference percentage, calculated as the percentage of selected cases within the reference cases. A larger deviation suggests a stronger influence on the selected outcome.
You can select multiple attributes for Root cause analysis.
Process map
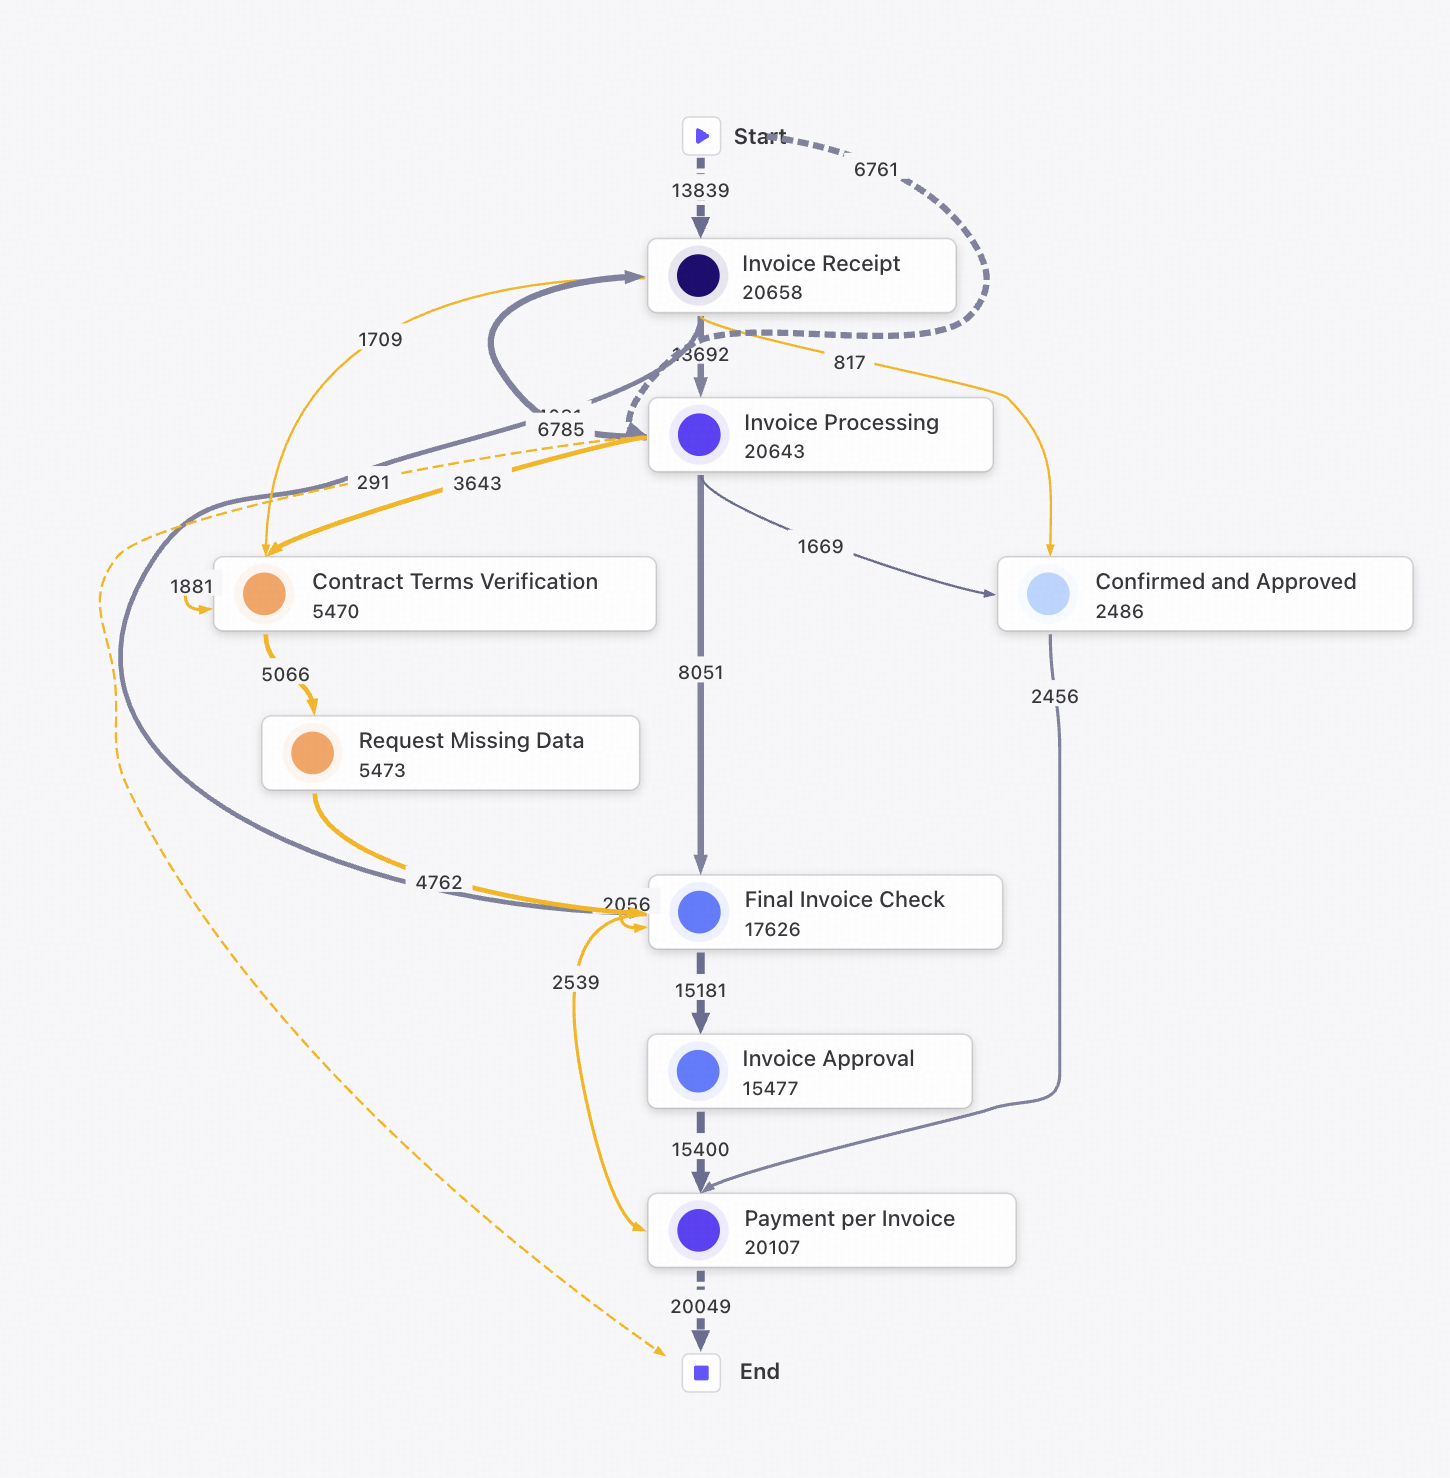
- View the current process map here. Yellow nodes and connections represent activities and edges that differ from the current model.
- Click an activity node to add it to the allow list and recalculate overview statistics.
For display behavior when node and edge counts exceed the limit, see Display limits.
Allow list
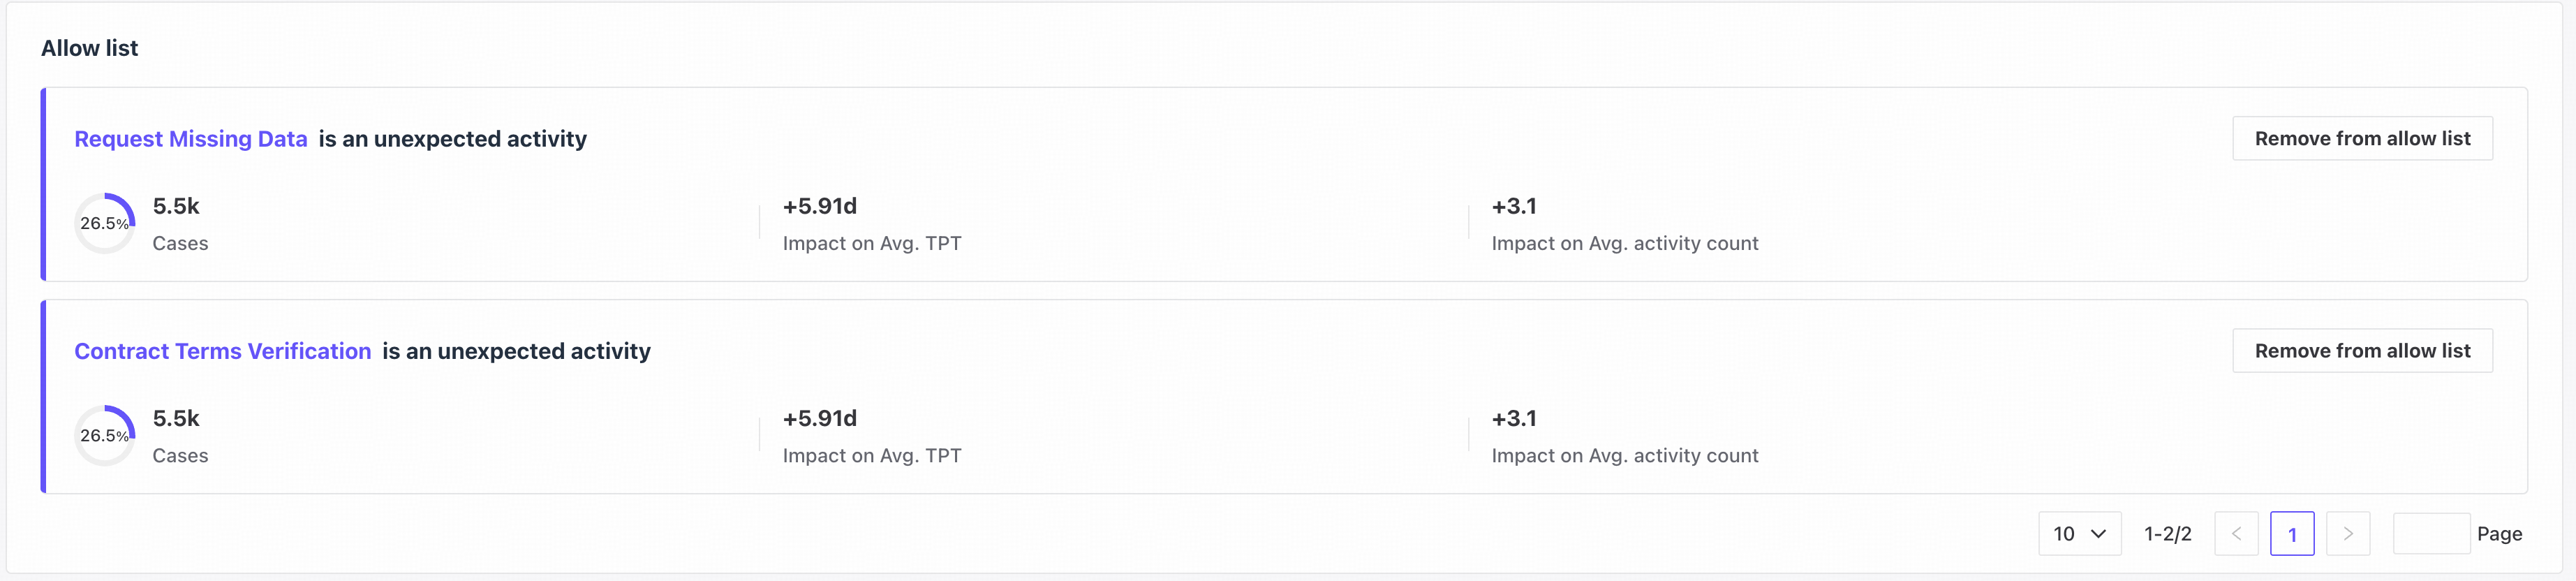
- The allow list contains all violations added to it.
- Click Remove from allow list to remove an entry.
Process model
If the active model was discovered with the process mining tool, Variant Explorer displays the loaded model.
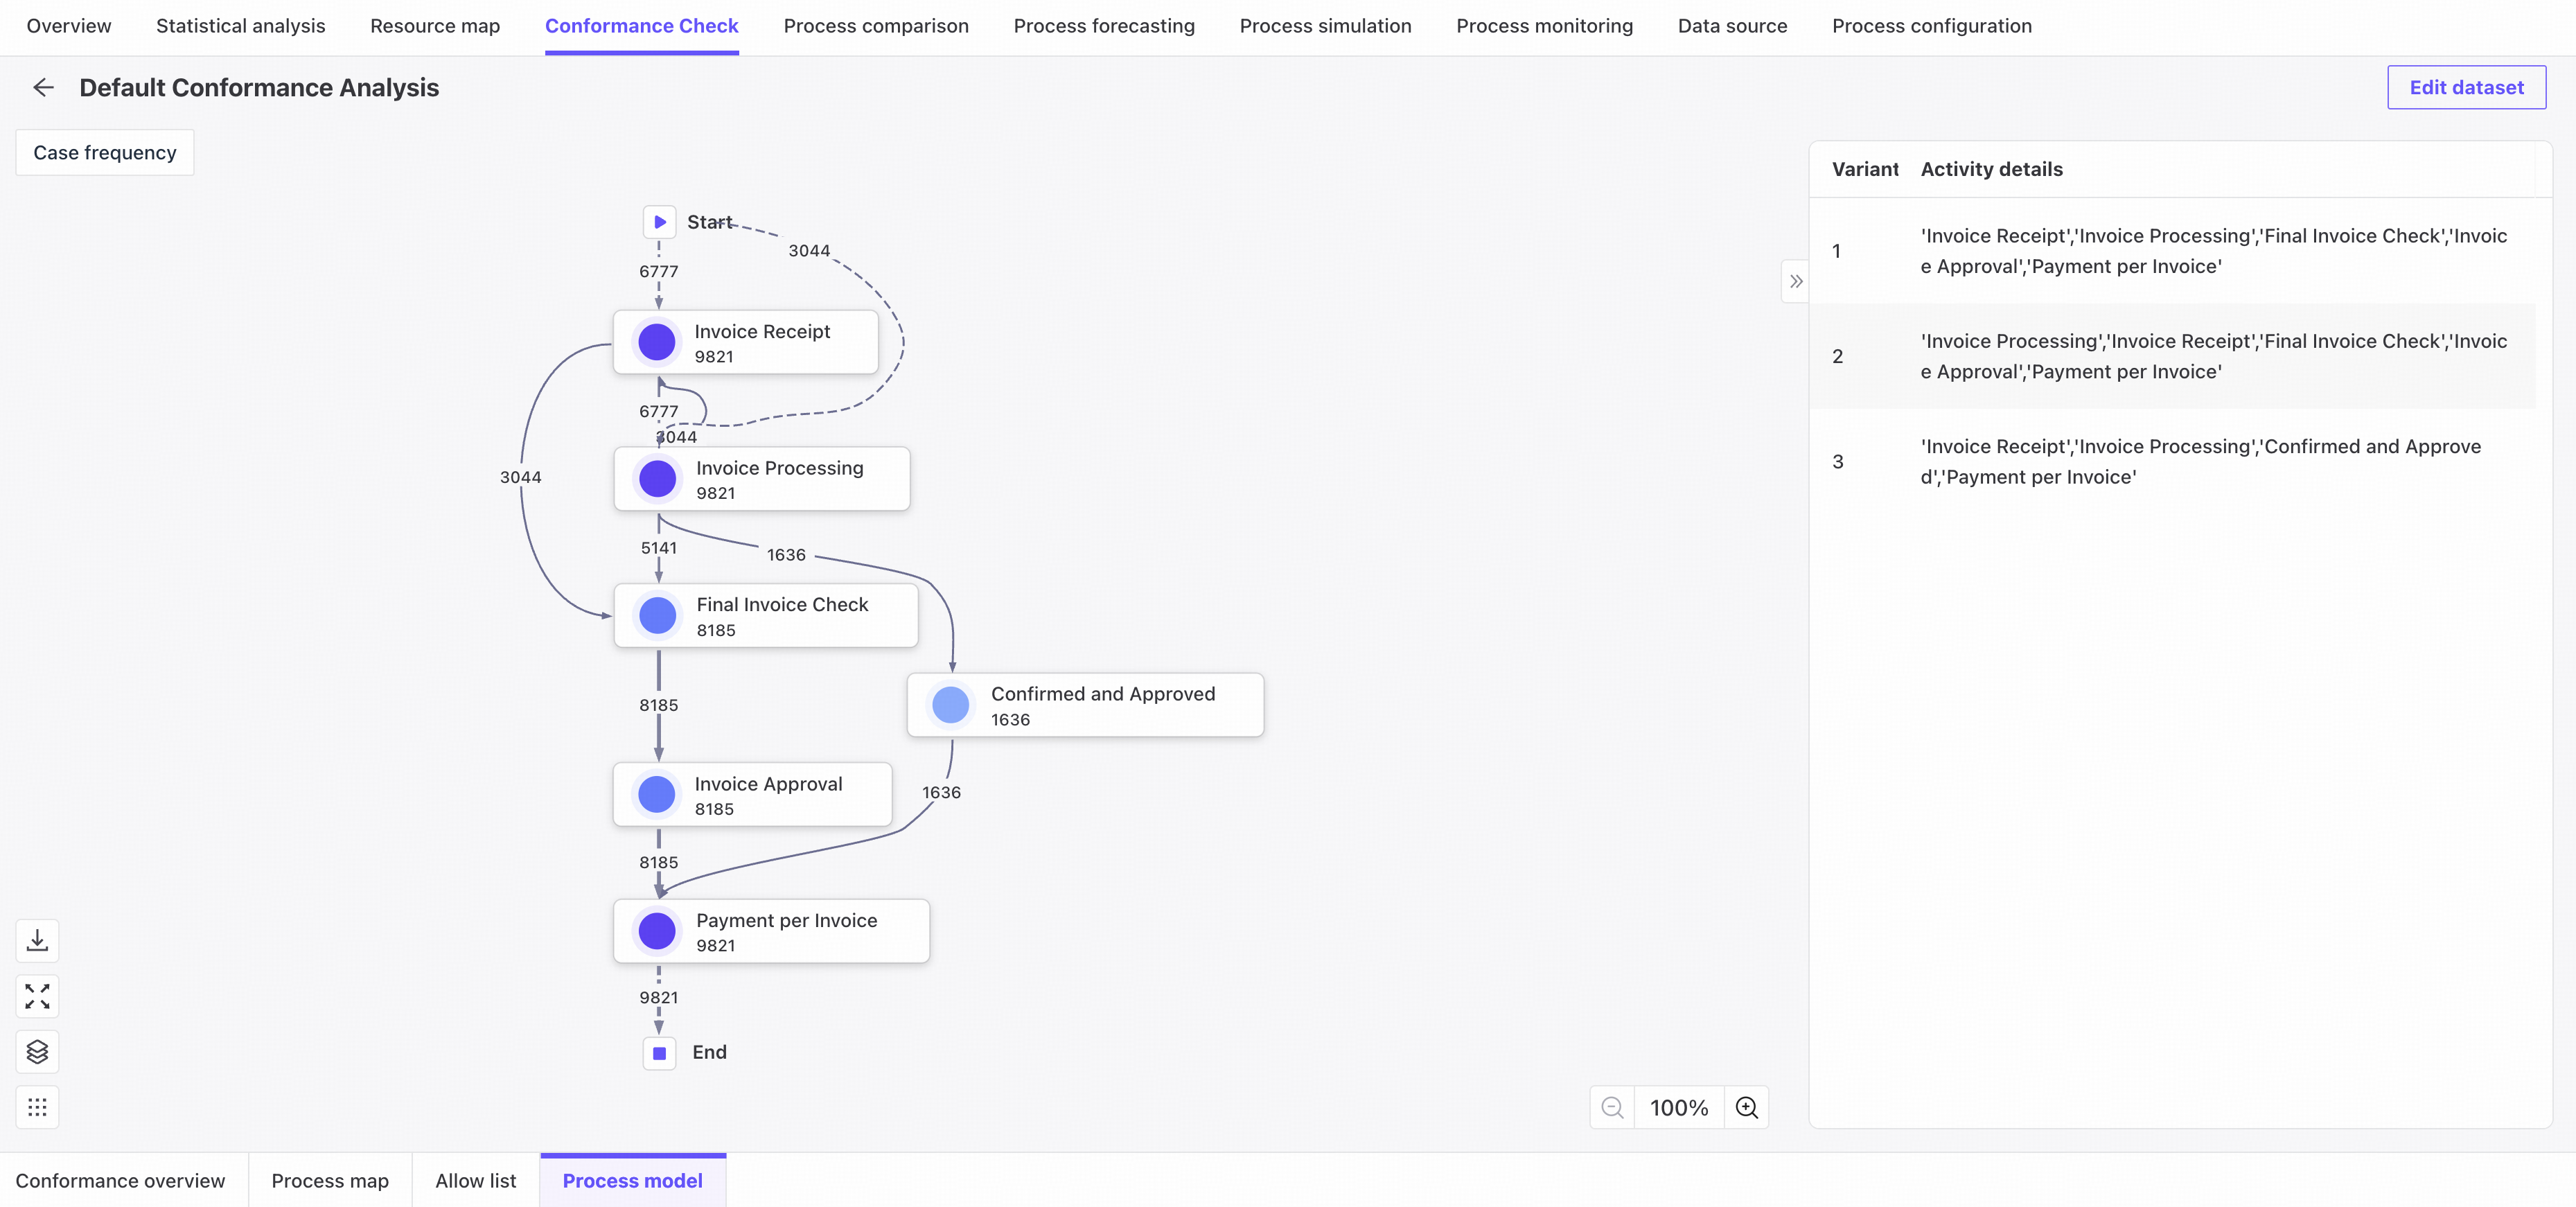
The process map cannot be displayed when the current model's node and edge counts exceed the display limit.
If a BPMN model is loaded, it is displayed as a BPMN diagram.
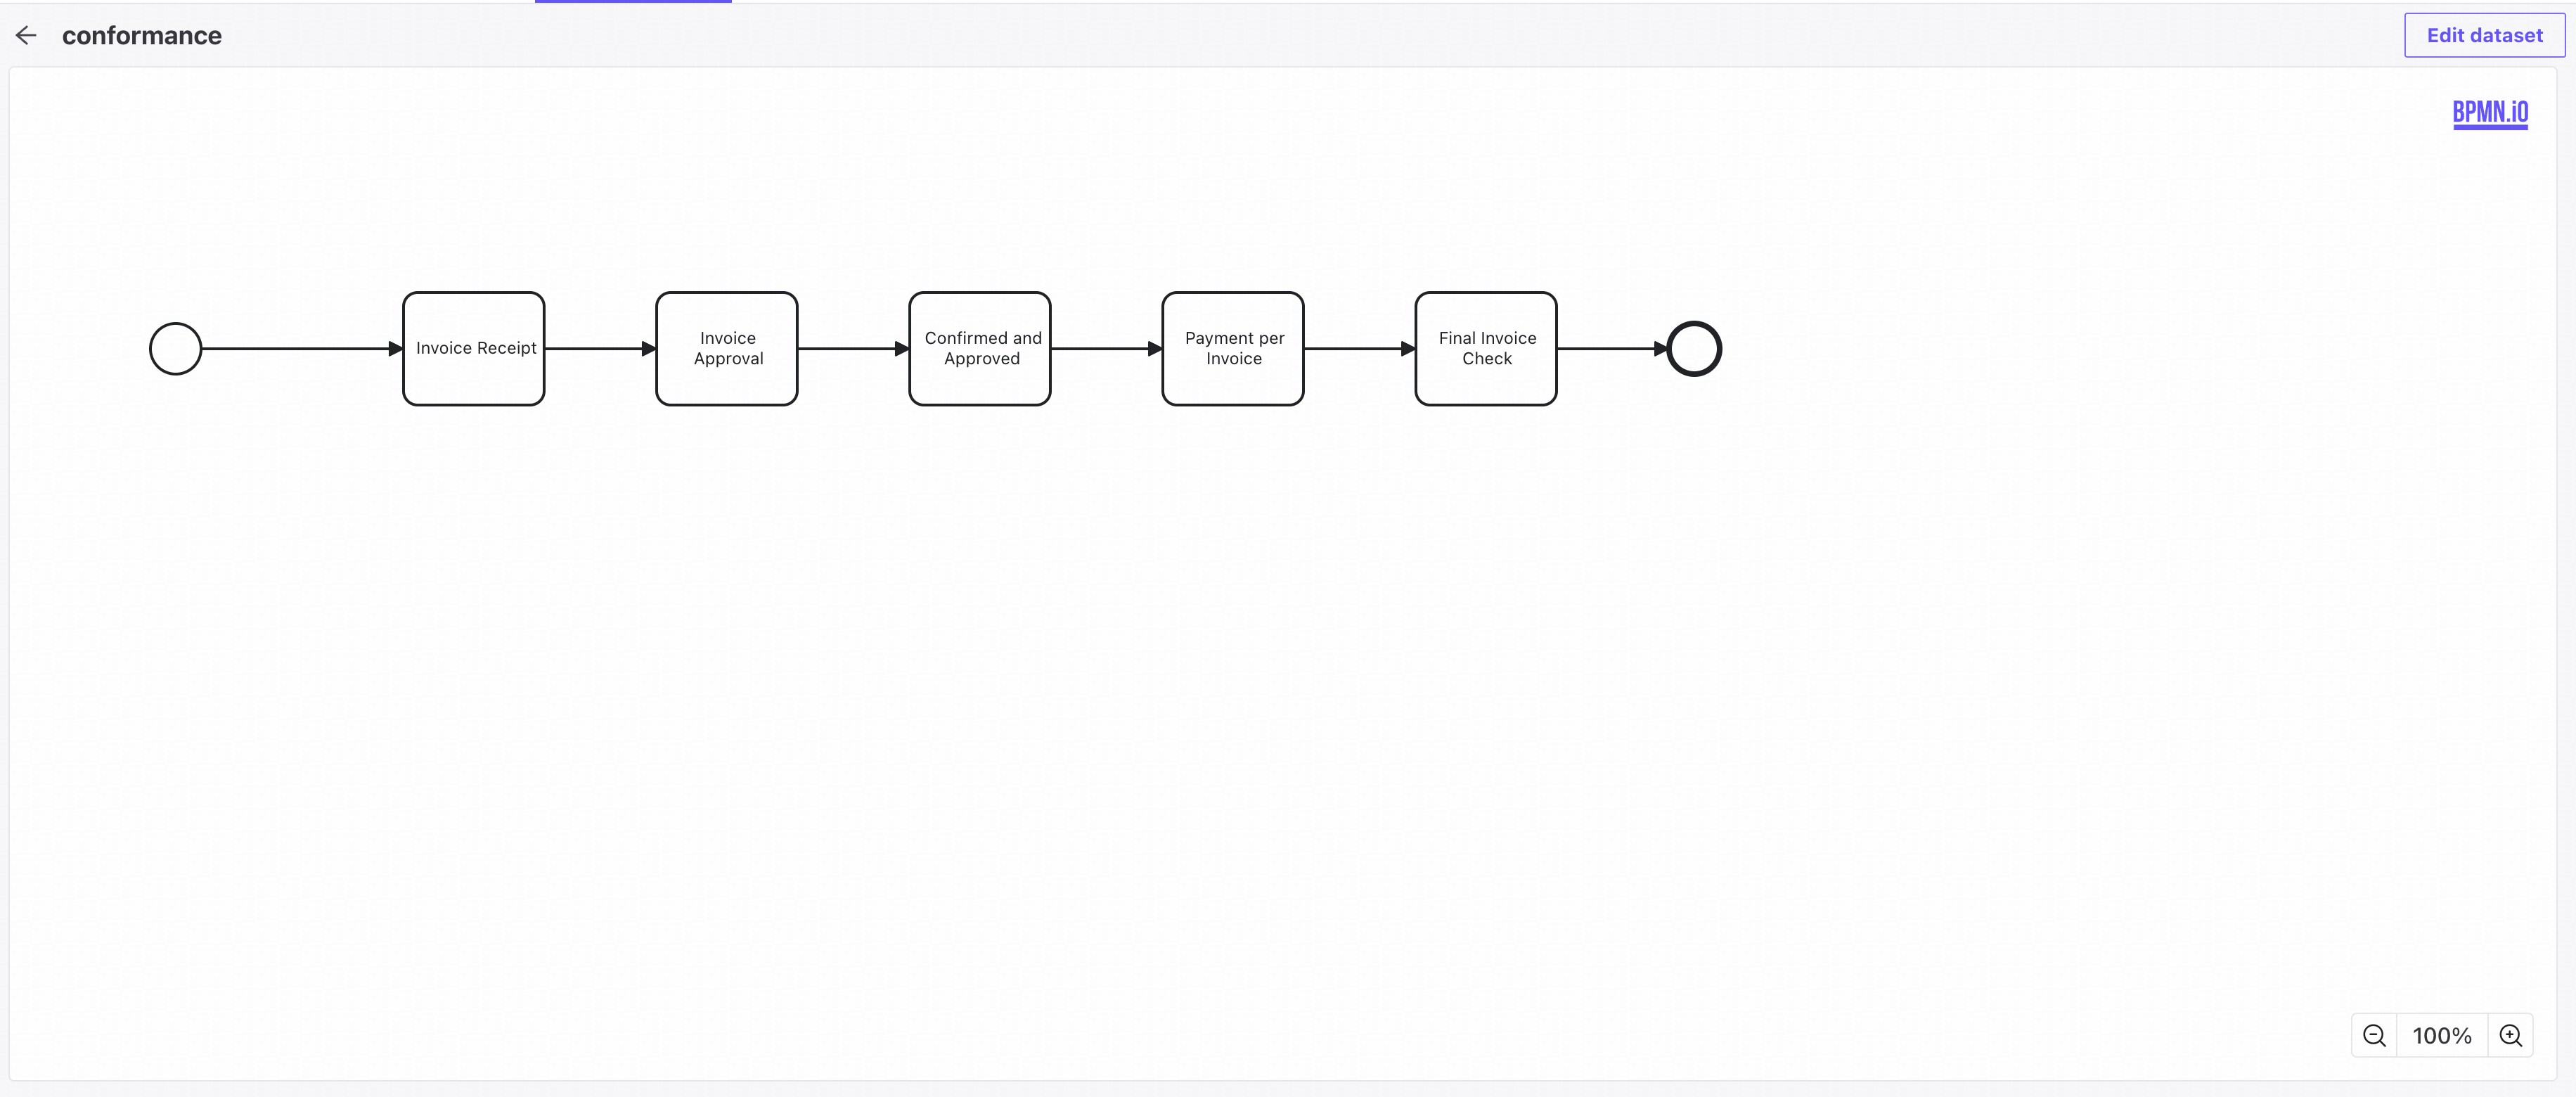
BPMN is a global standard for process modeling. Process models use BPMN 2.0 notation, consisting of activities, connections, gateways, and start/end nodes. Other elements, such as annotations, are ignored. For more information, visit the BPMN website.