Task overview page
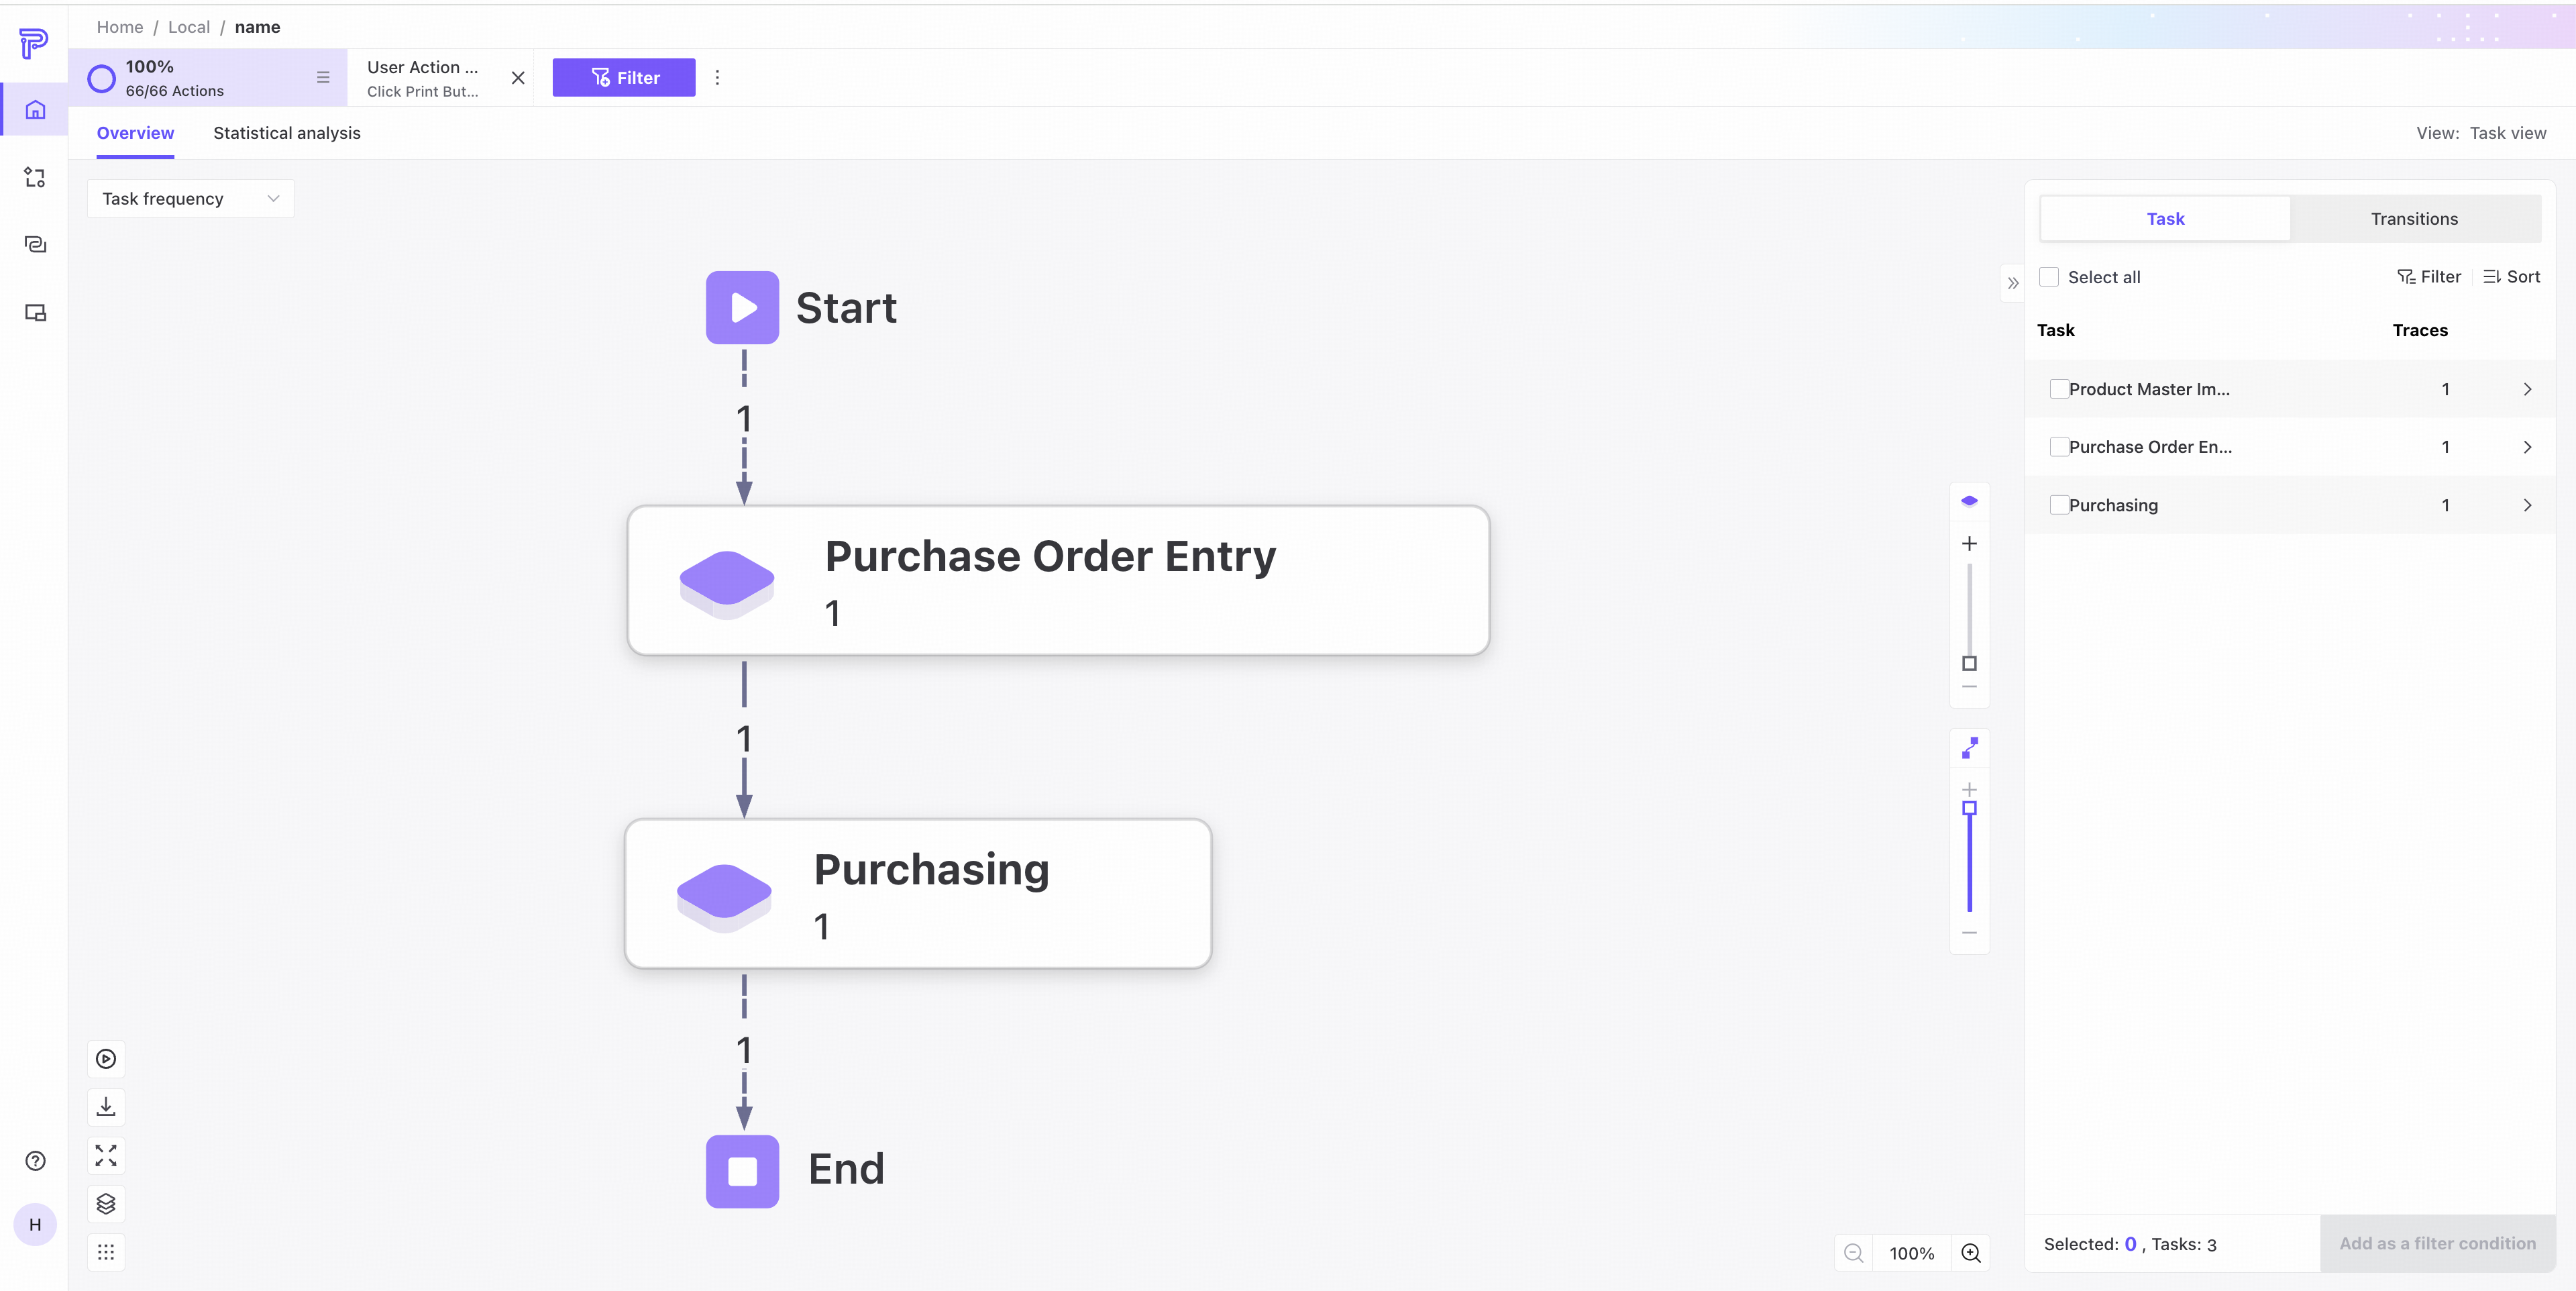
After model generation, the Task overview opens automatically. View KPIs, the process map, and basic task information here.
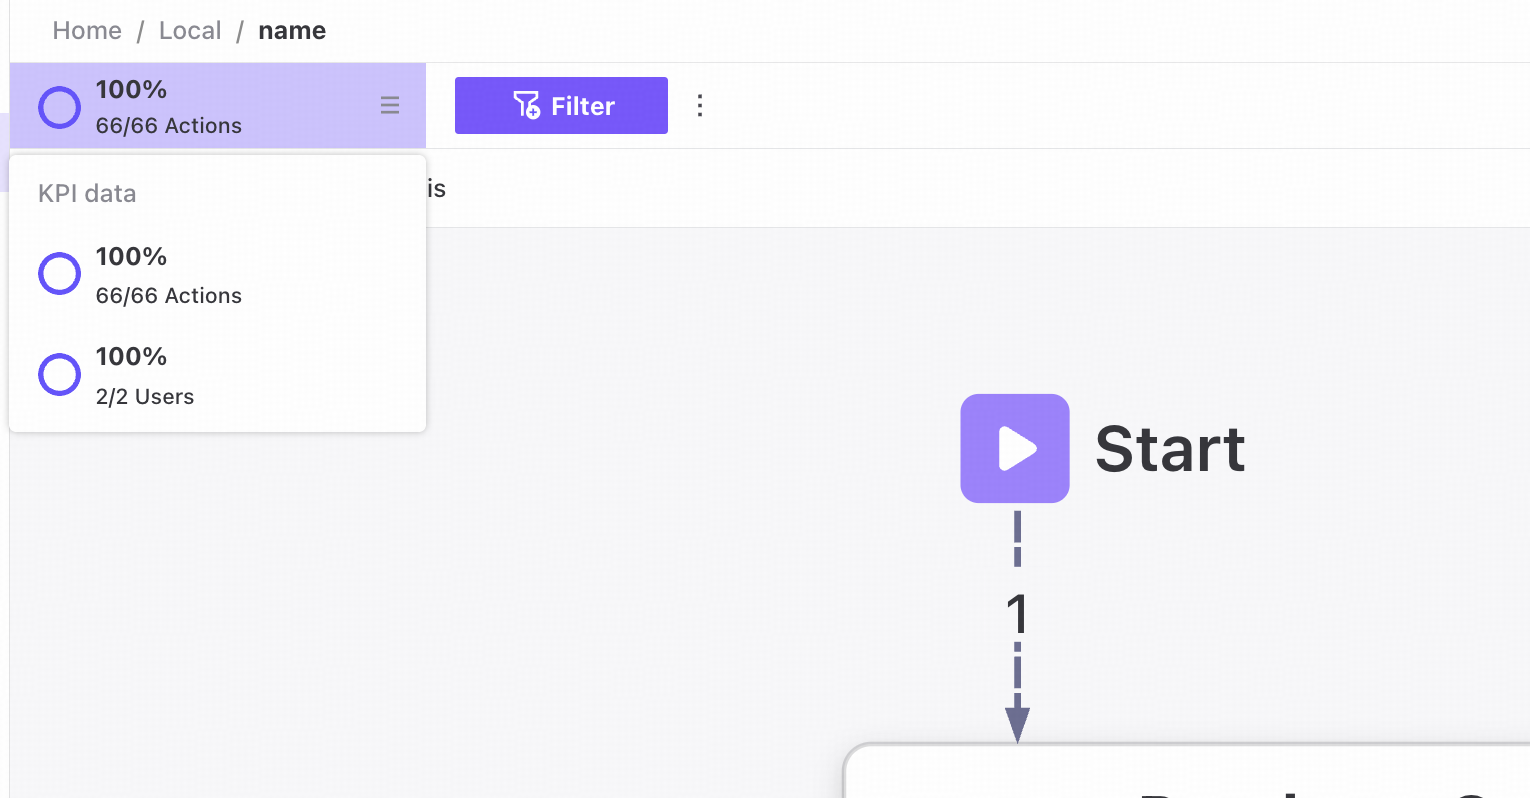
KPI data
The upper-left area shows basic KPIs for the current task analysis. Click to open a list of action, user, and application/page counts.
Process map
Process map panel
The Task mining process map shows transitions between tasks.
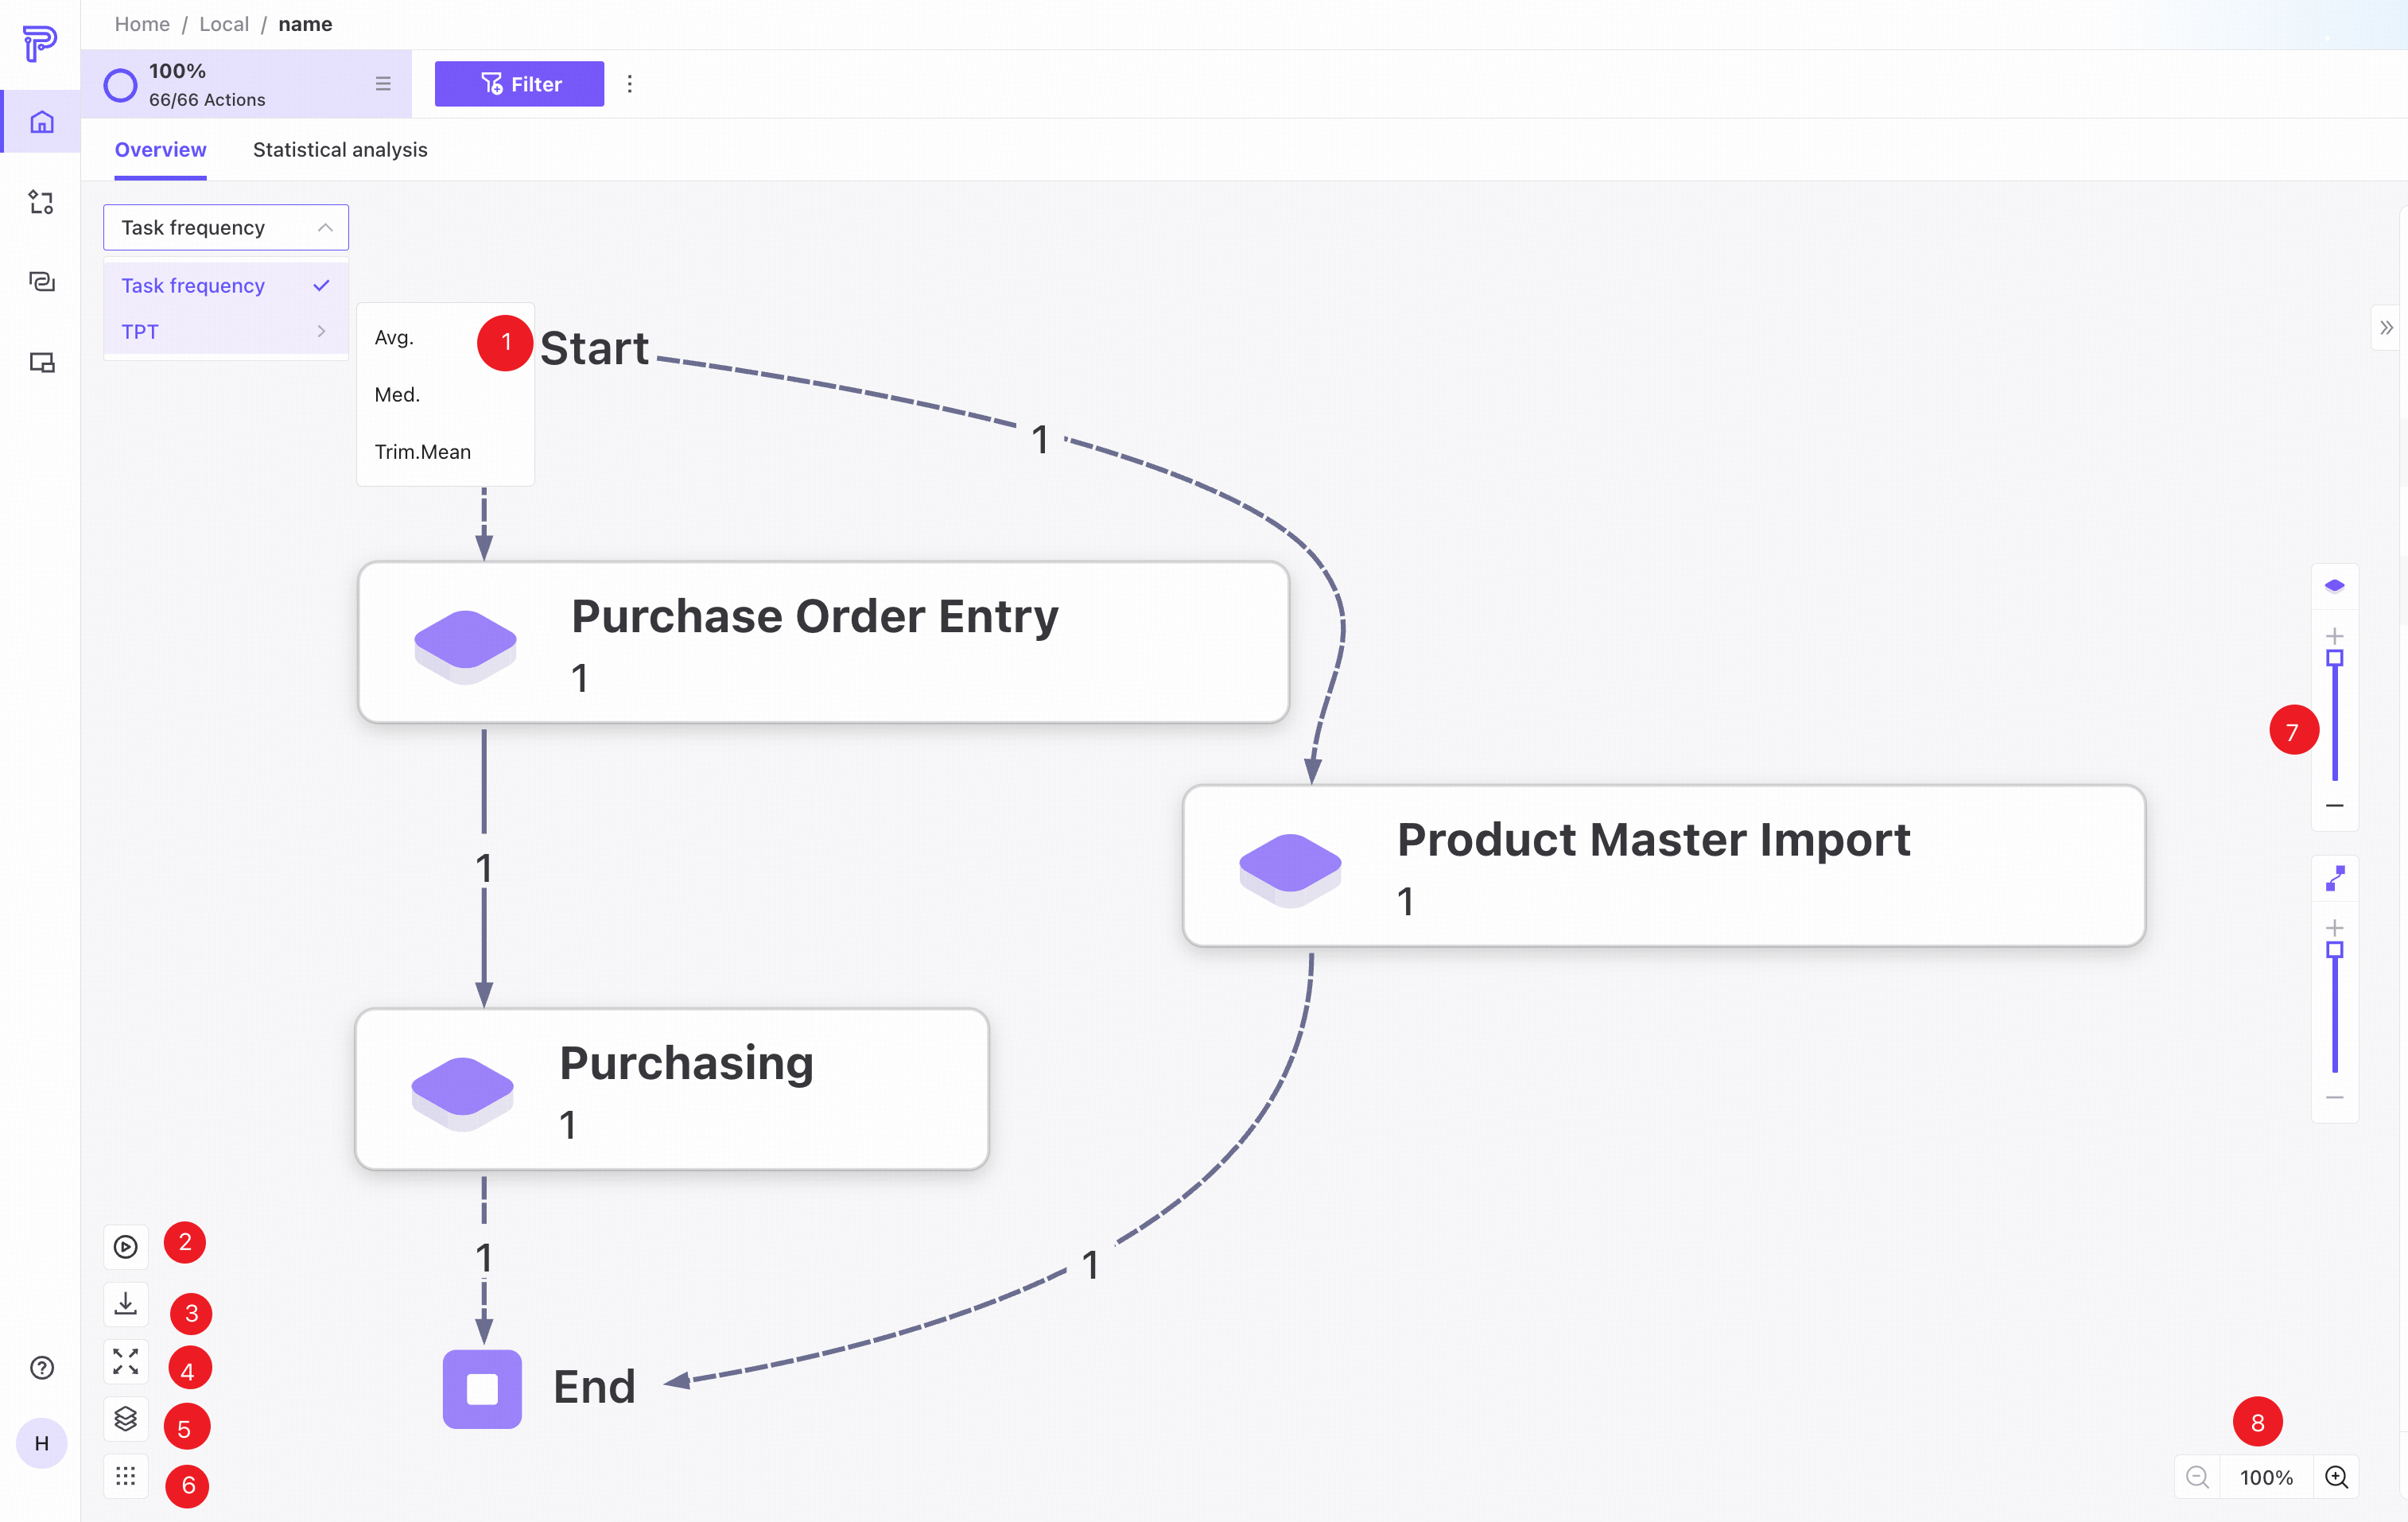
❶ Switch the map between task frequency and throughput time.
❷ Play task transition animations. Each red bubble represents a record and shows its task transitions.
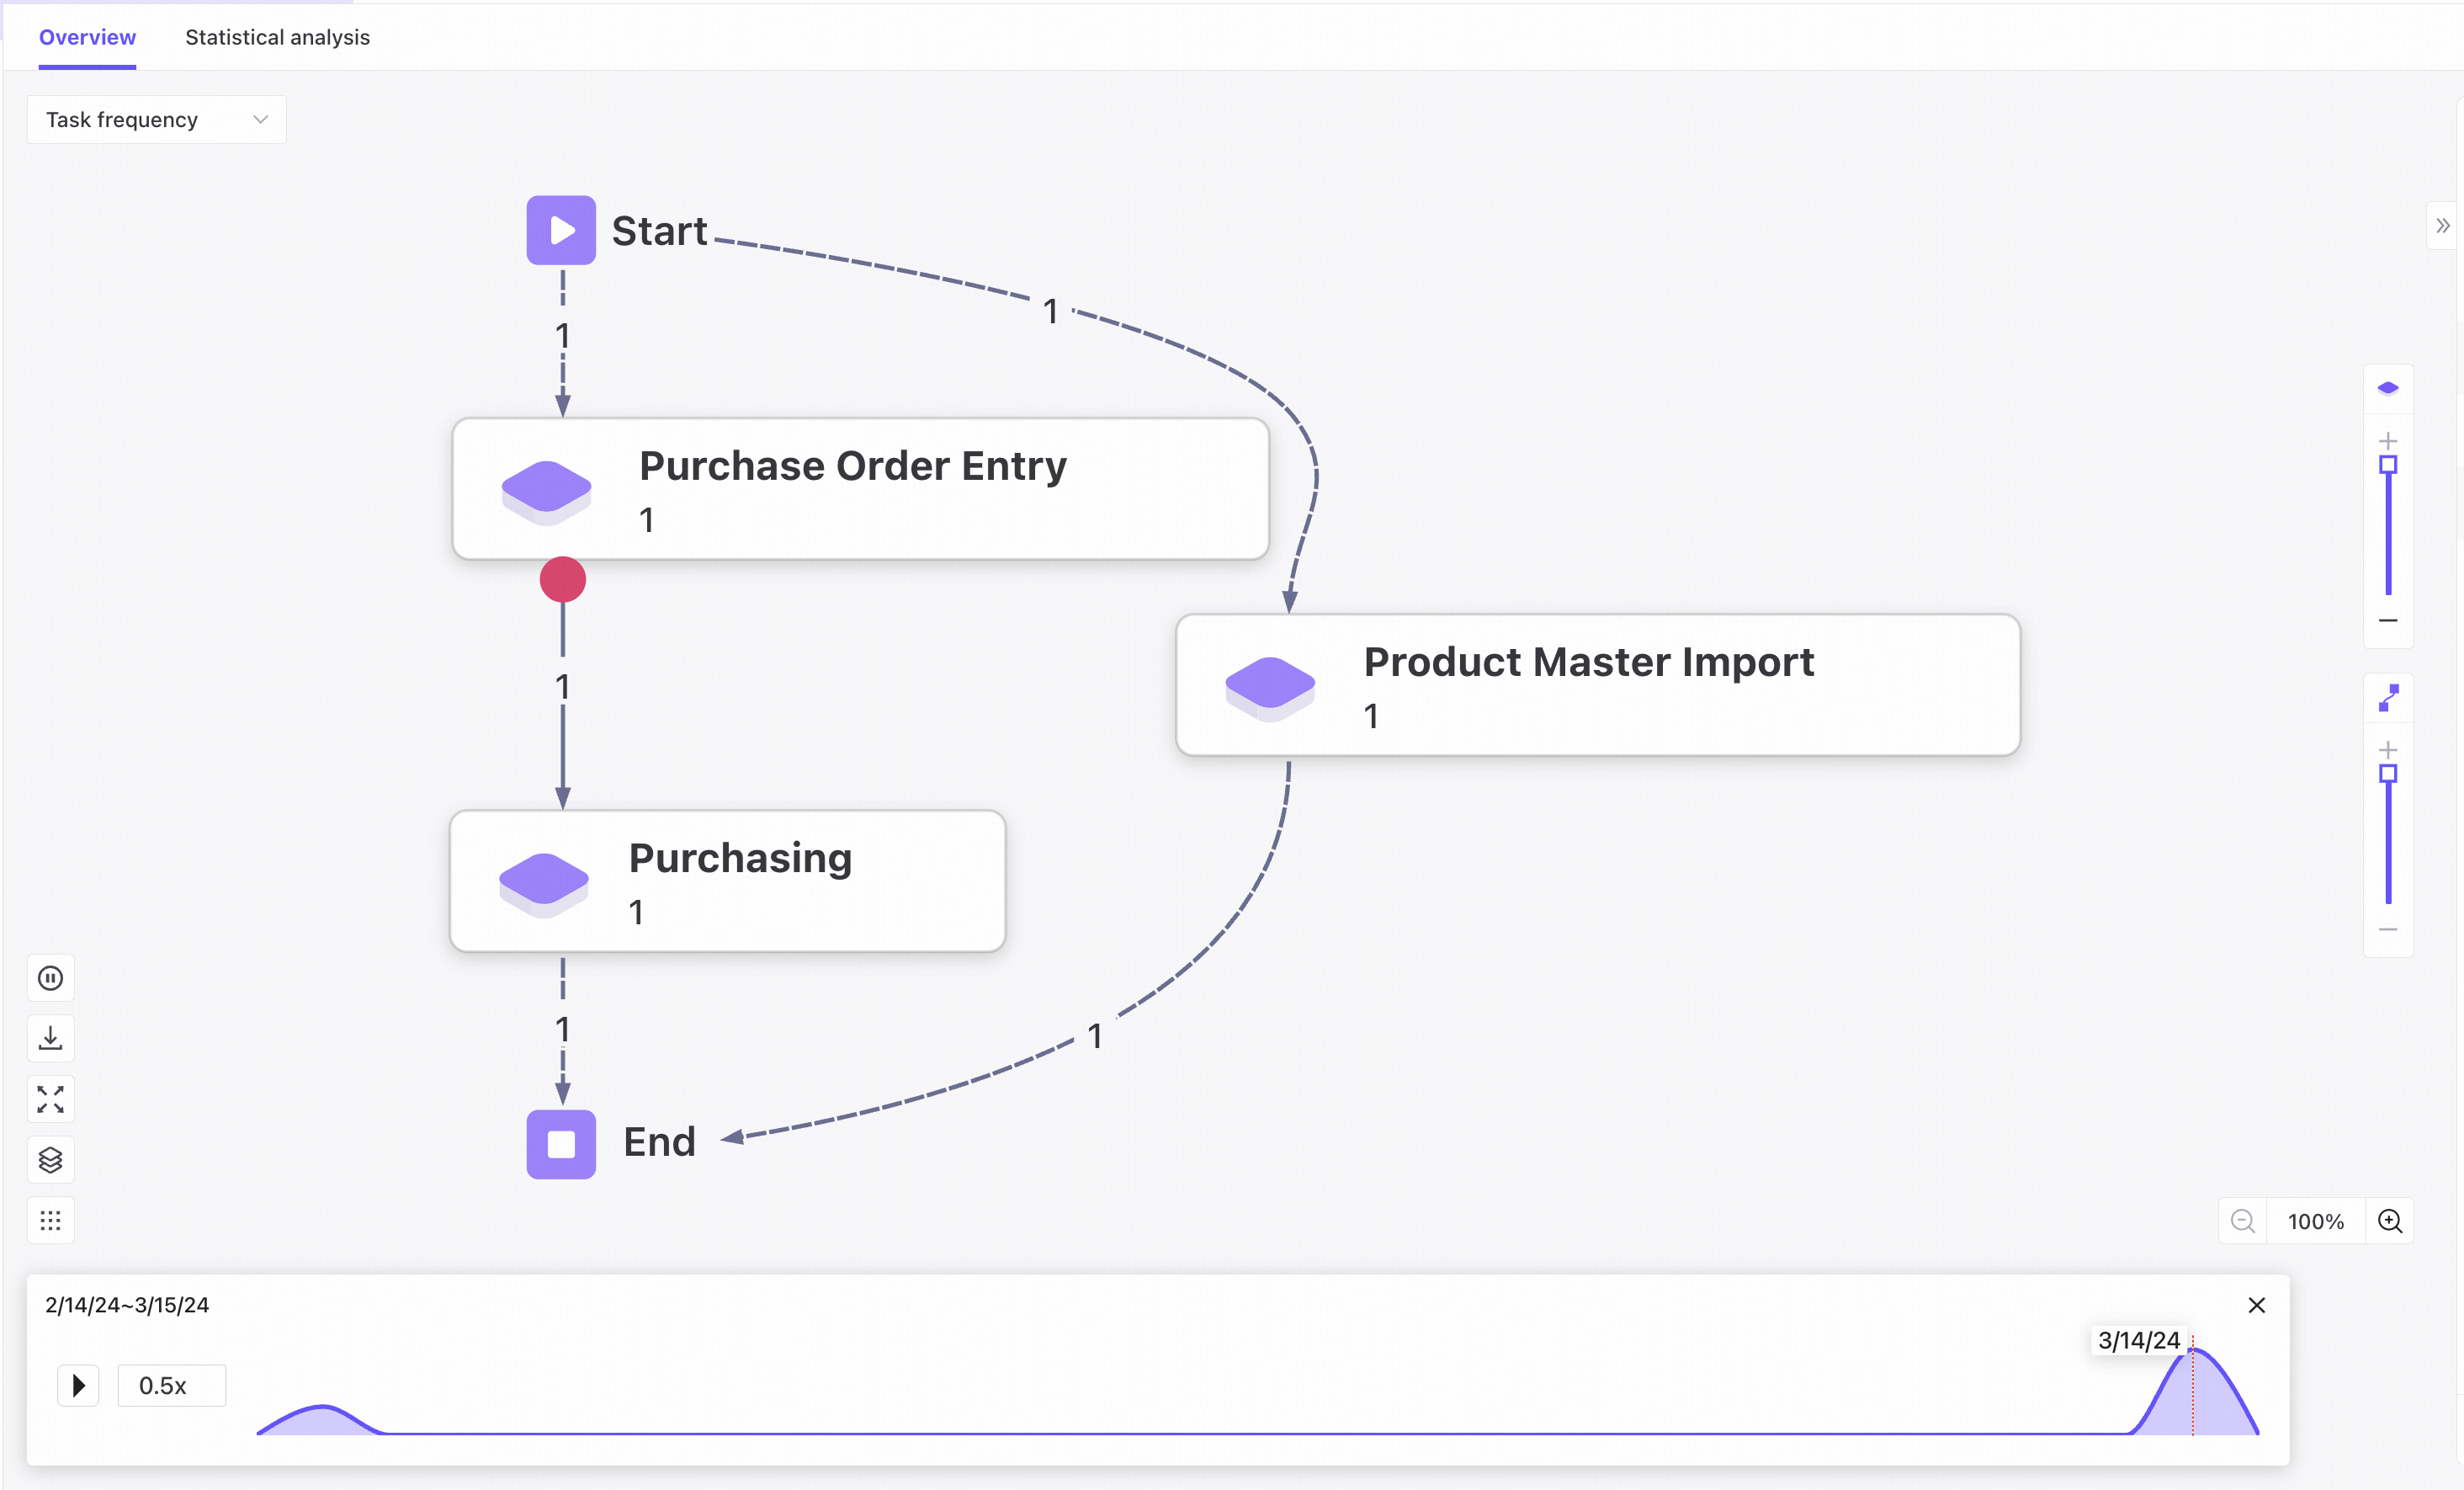
A record is the set of all actions performed by one user in a day.
❸ Export the current map as SVG.
❹ Display the map in full screen.
❺ Show the map legend.
❻ Switch the map background.
❼ Drag the complexity sliders to adjust the tasks and edges displayed.
❽ Zoom from 100% to 400%.
Task and edge details
Task details
Click a task node to view its details.
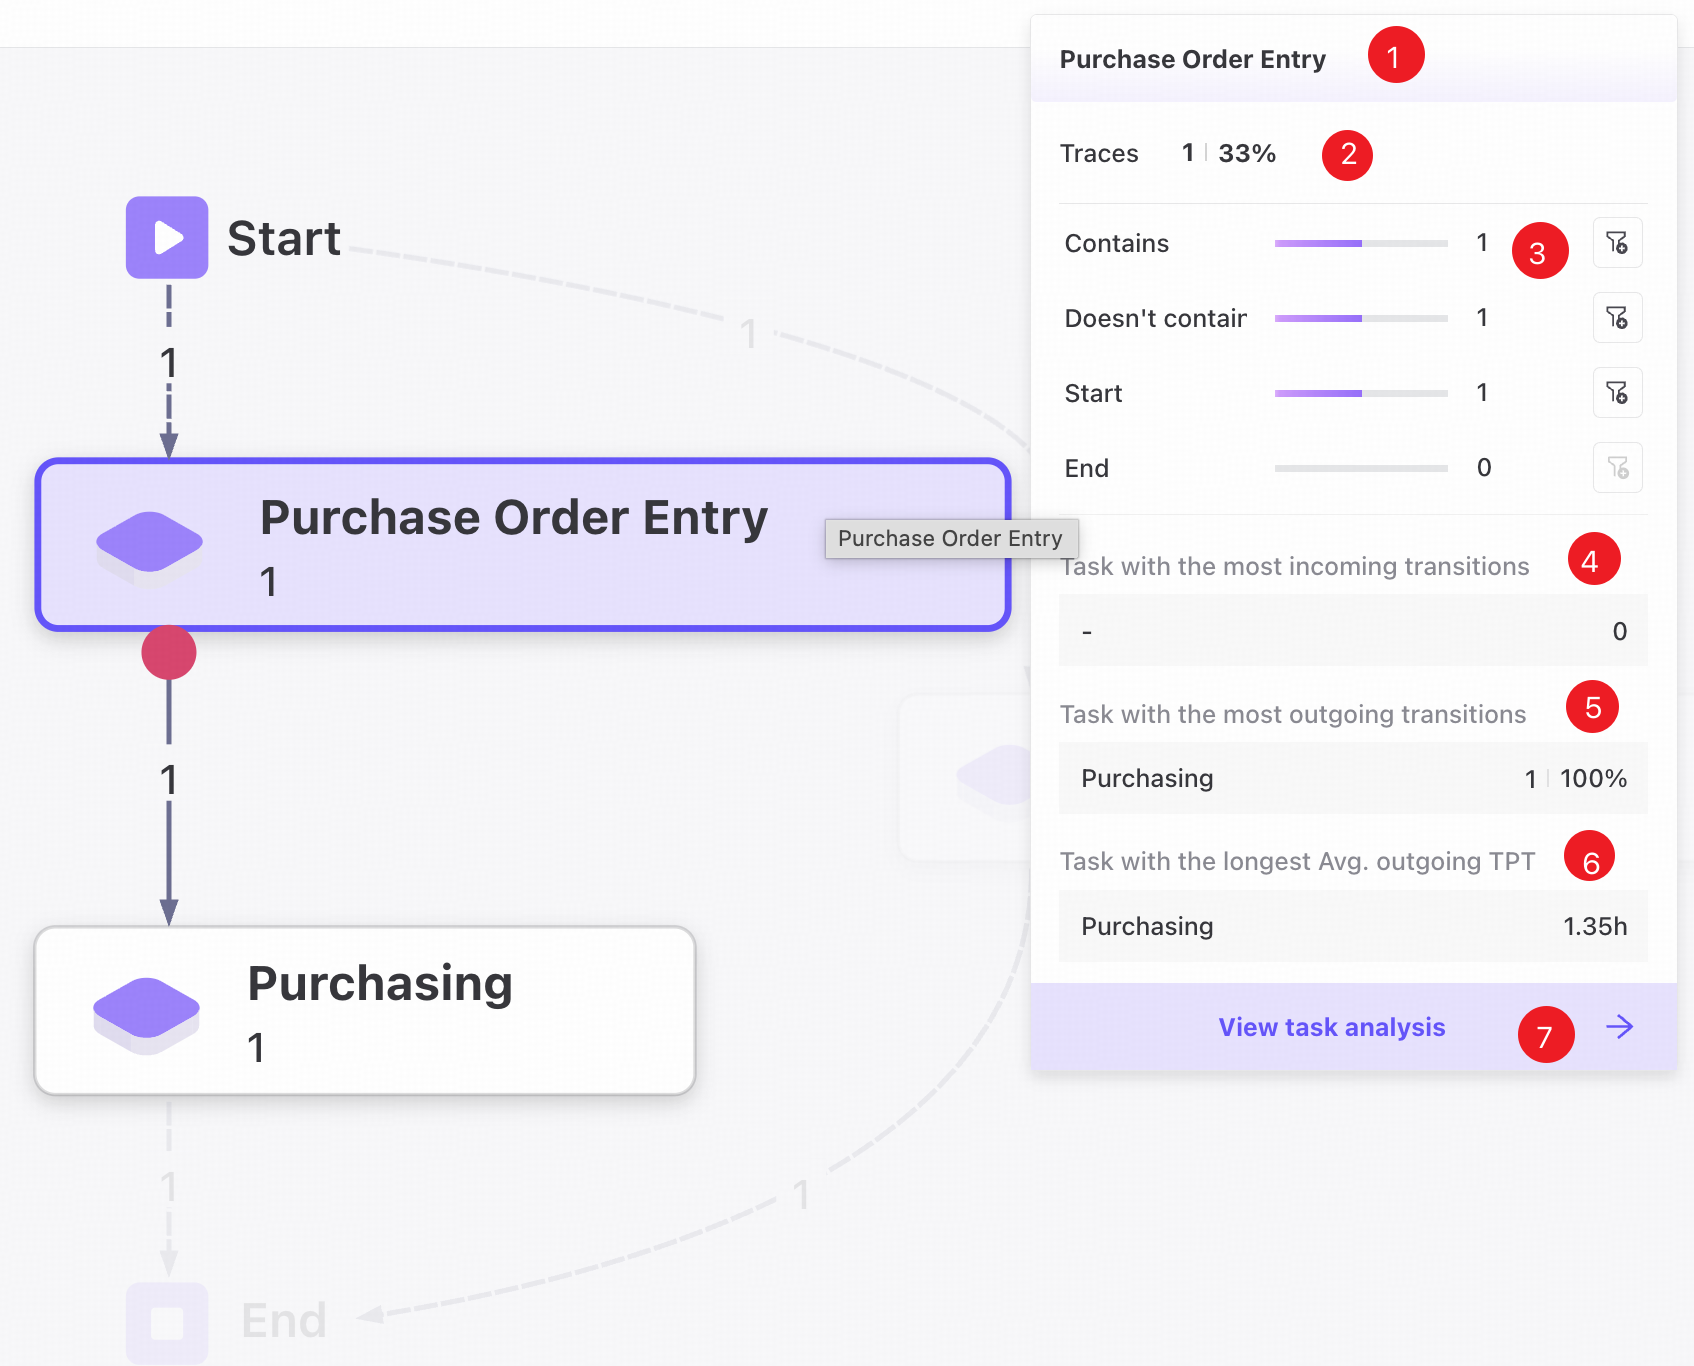
❶ Task node name.
❷ Trace count and percentage of traces.
❸ Record counts including or excluding the task, and starting or ending with it.
❹ The task with the most transitions into this task.
❺ The task receiving the most transitions from this task.
❻ The outgoing task with the longest average throughput time.
❼ Open the task analysis page.
Edge details
Click a connection between task nodes to view its details.
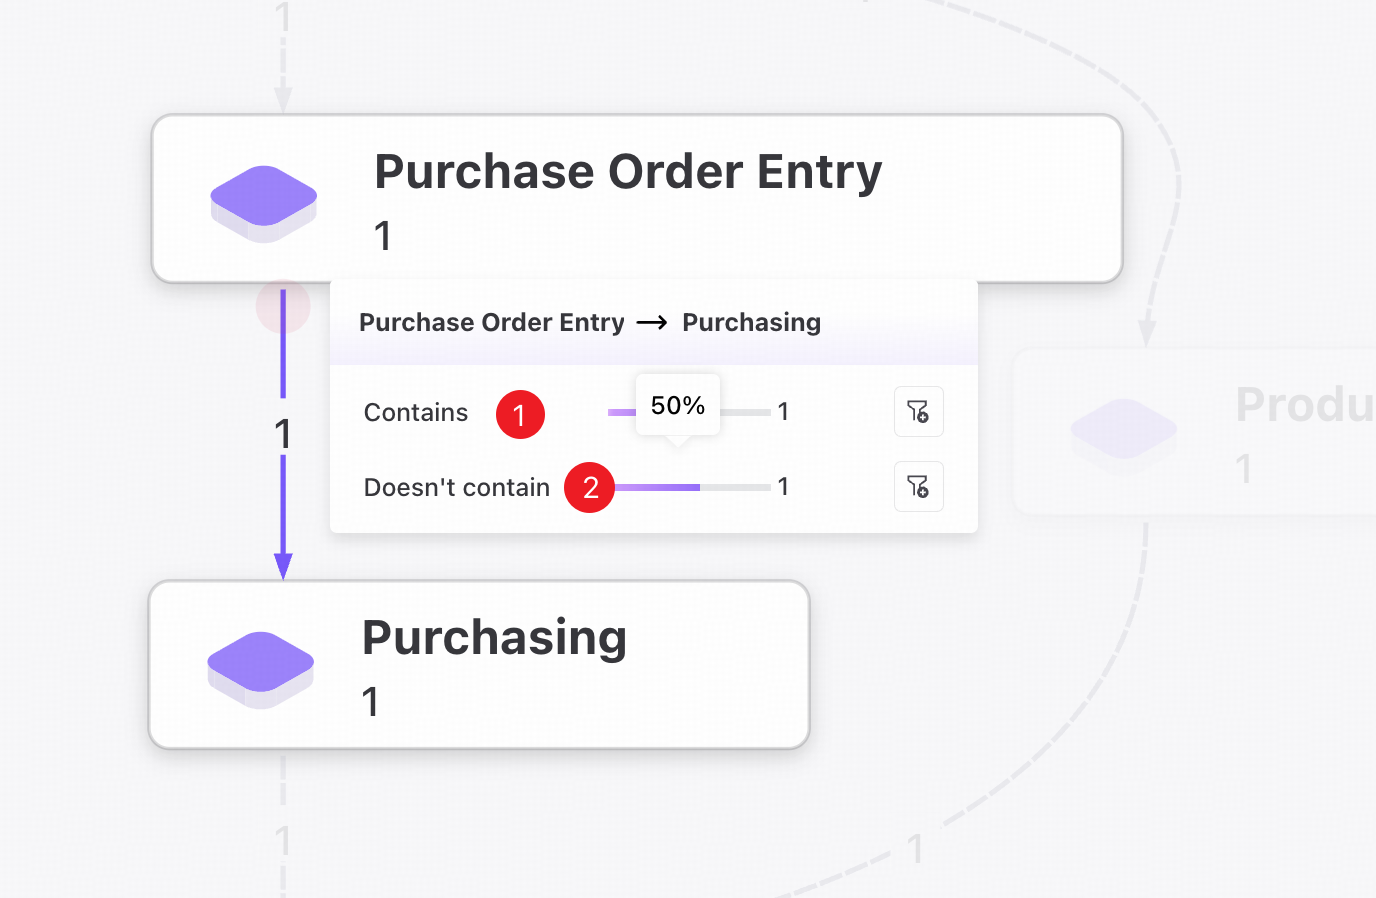
❶ Number of records including the edge.
❷ Number of records excluding the edge.
Task list
View basic information for each task.
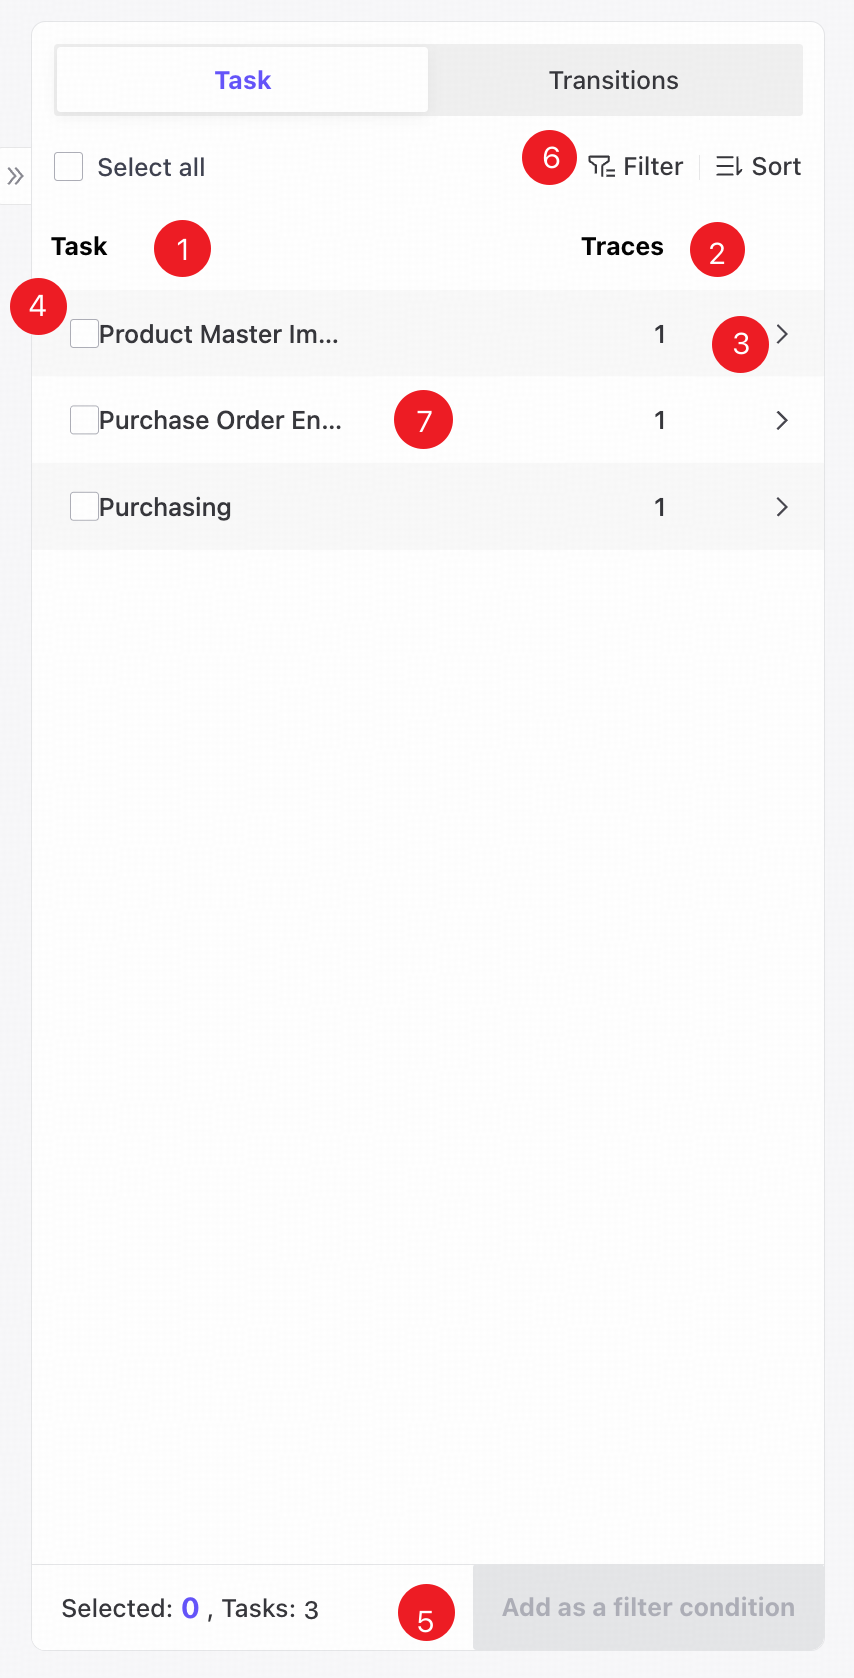
❶ Task name.
❷ Trace count for the task.
A trace is the set of actions performed by one user during a single execution of a task.
❸ Click the arrow to open the corresponding task analysis.
❹ Select individual tasks or select all using the checkboxes.
❺ Add selected tasks as filter conditions.
❻ Filter or sort displayed data by specific conditions.
❼ Hover over a task to see its details.
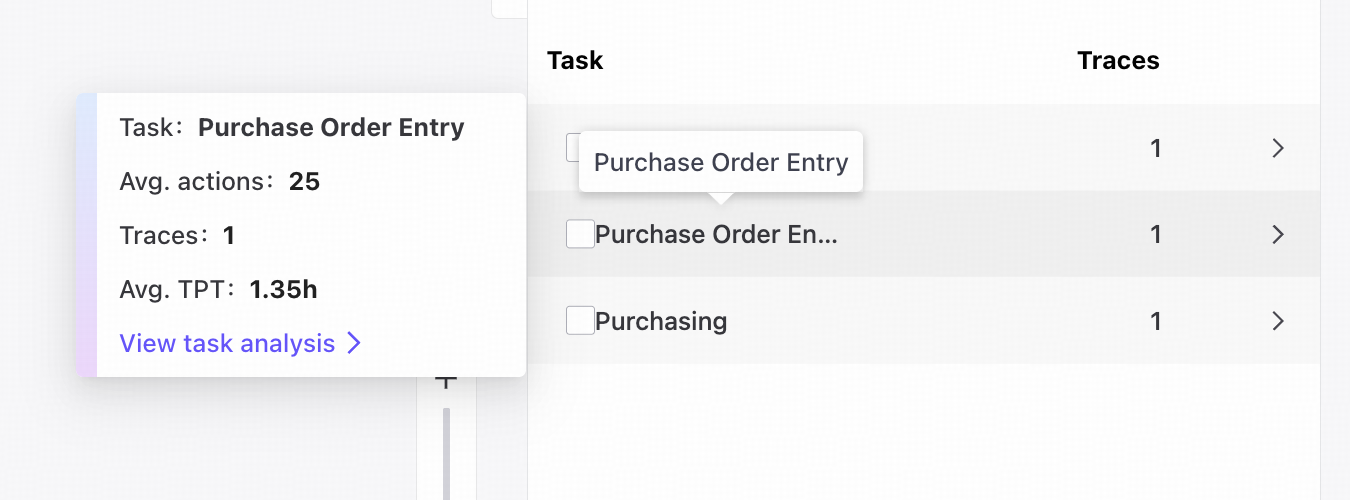
- Task name
- Average action count
- Trace count
- Average throughput time
- Link to task analysis
Task transitions
View basic information about transitions between tasks.
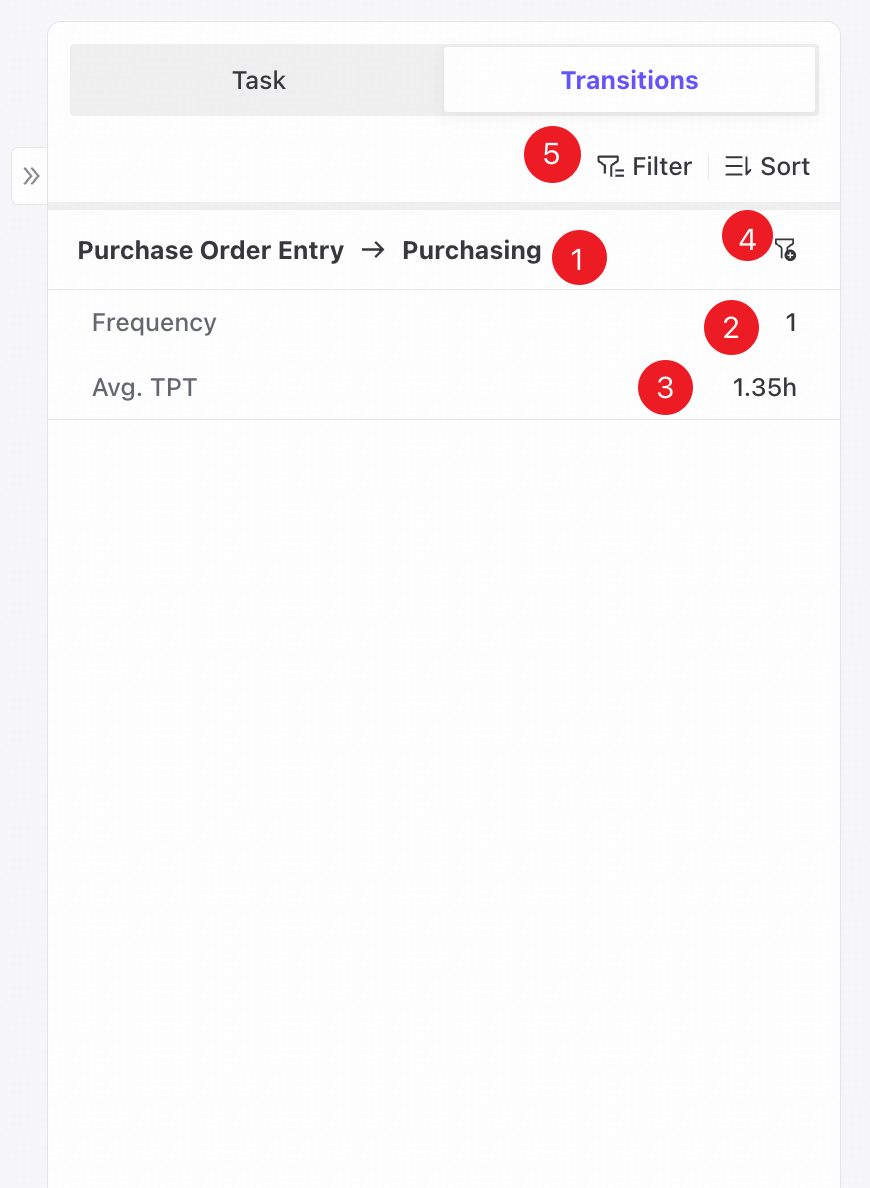
❶ Transition name.
❷ Transition frequency.
❸ Average throughput time of the transition.
❹ Add the transition as a filter condition.
❺ Filter or sort displayed data by specific conditions.