Task analysis overview
Click the task analysis link on Overview to analyze a task in more detail at the user-action level. View KPIs, the process map, and actions within the task.
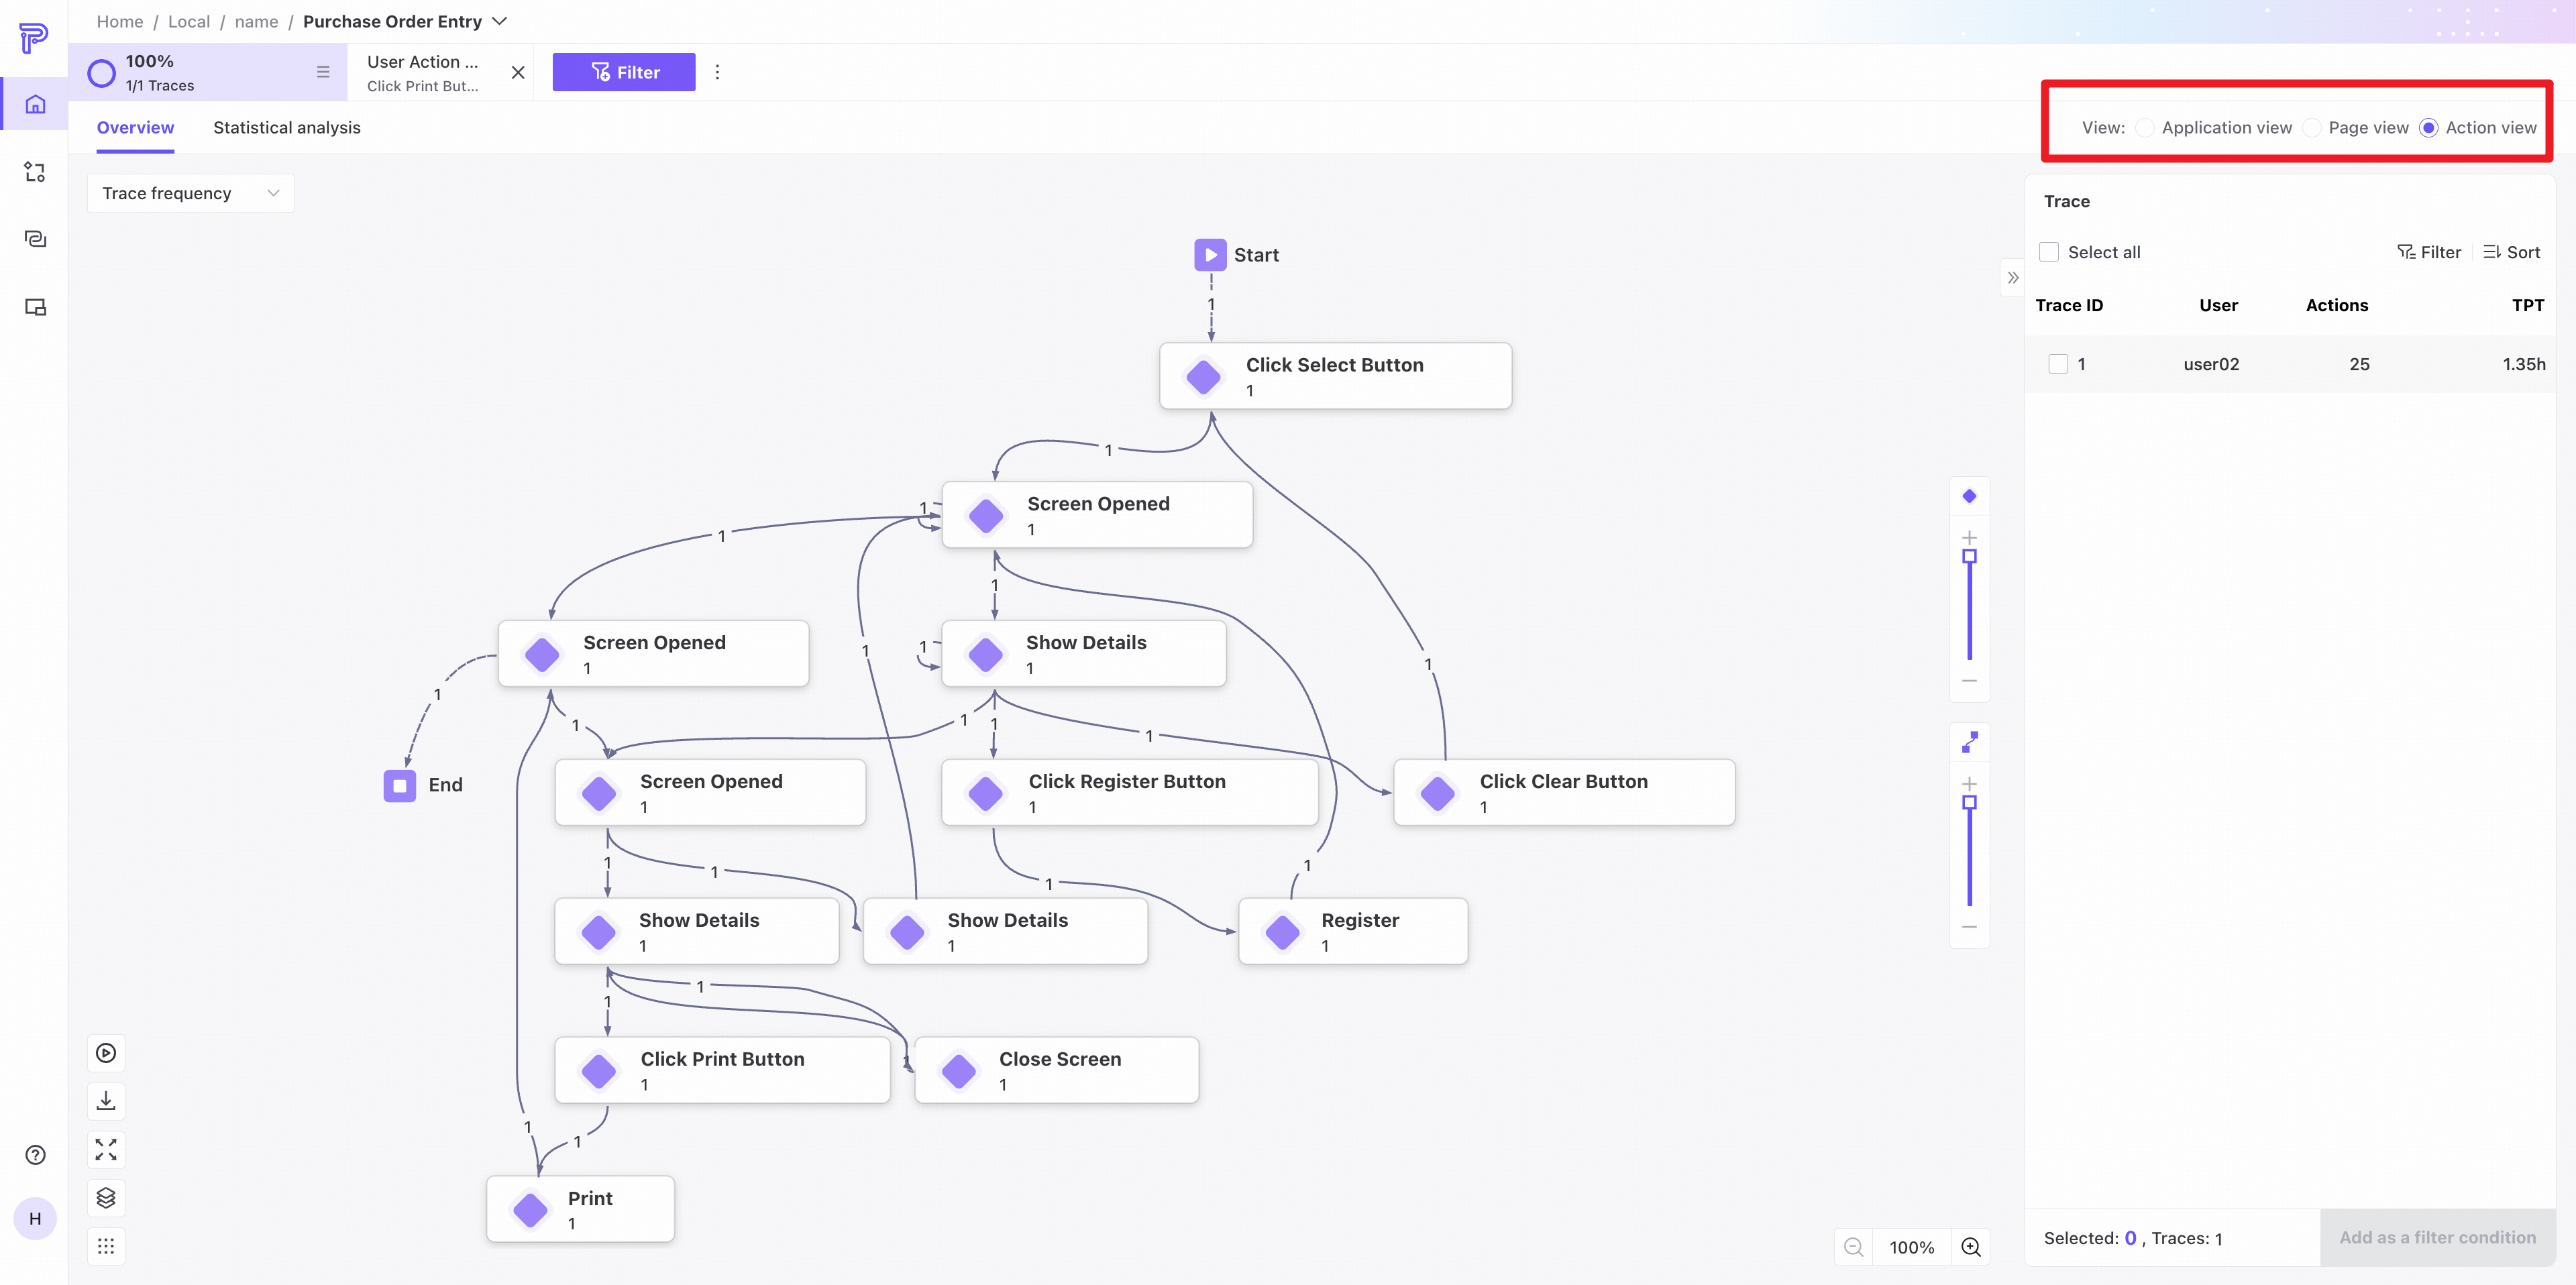
Switch analysis views in the upper-right corner to examine application, page, and user-action transitions.
If Task, App, and Page were selected as dimensions, Application, Page, and Action views are available.
If App and Page were selected, Page and Action views are available.
If only Page was selected, only Action view is available.
Switching views does not change the Trace list.
KPI data
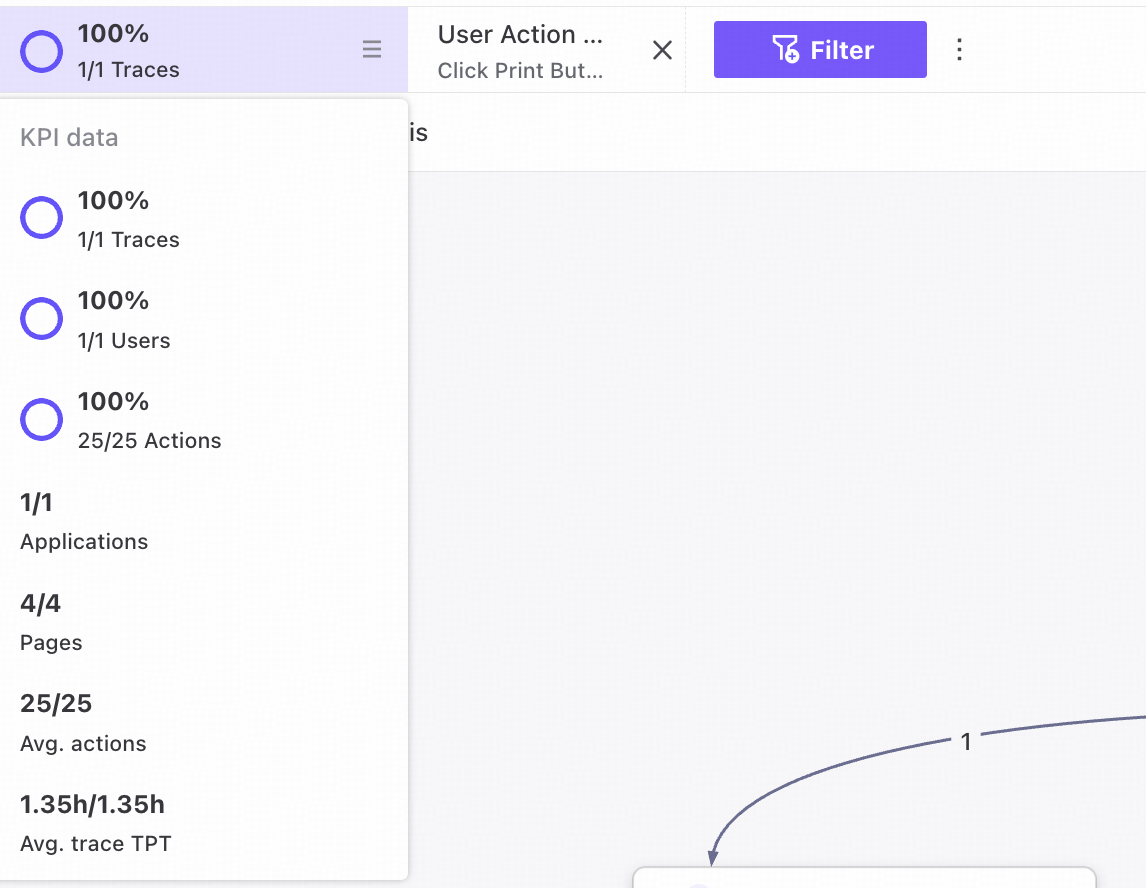
The upper-left area shows the task's basic KPIs. Click to view trace count, user count, action count, average action count, and average throughput time per trace.
Process map
Process map panel
The task-specific process map shows the action flow within the task.
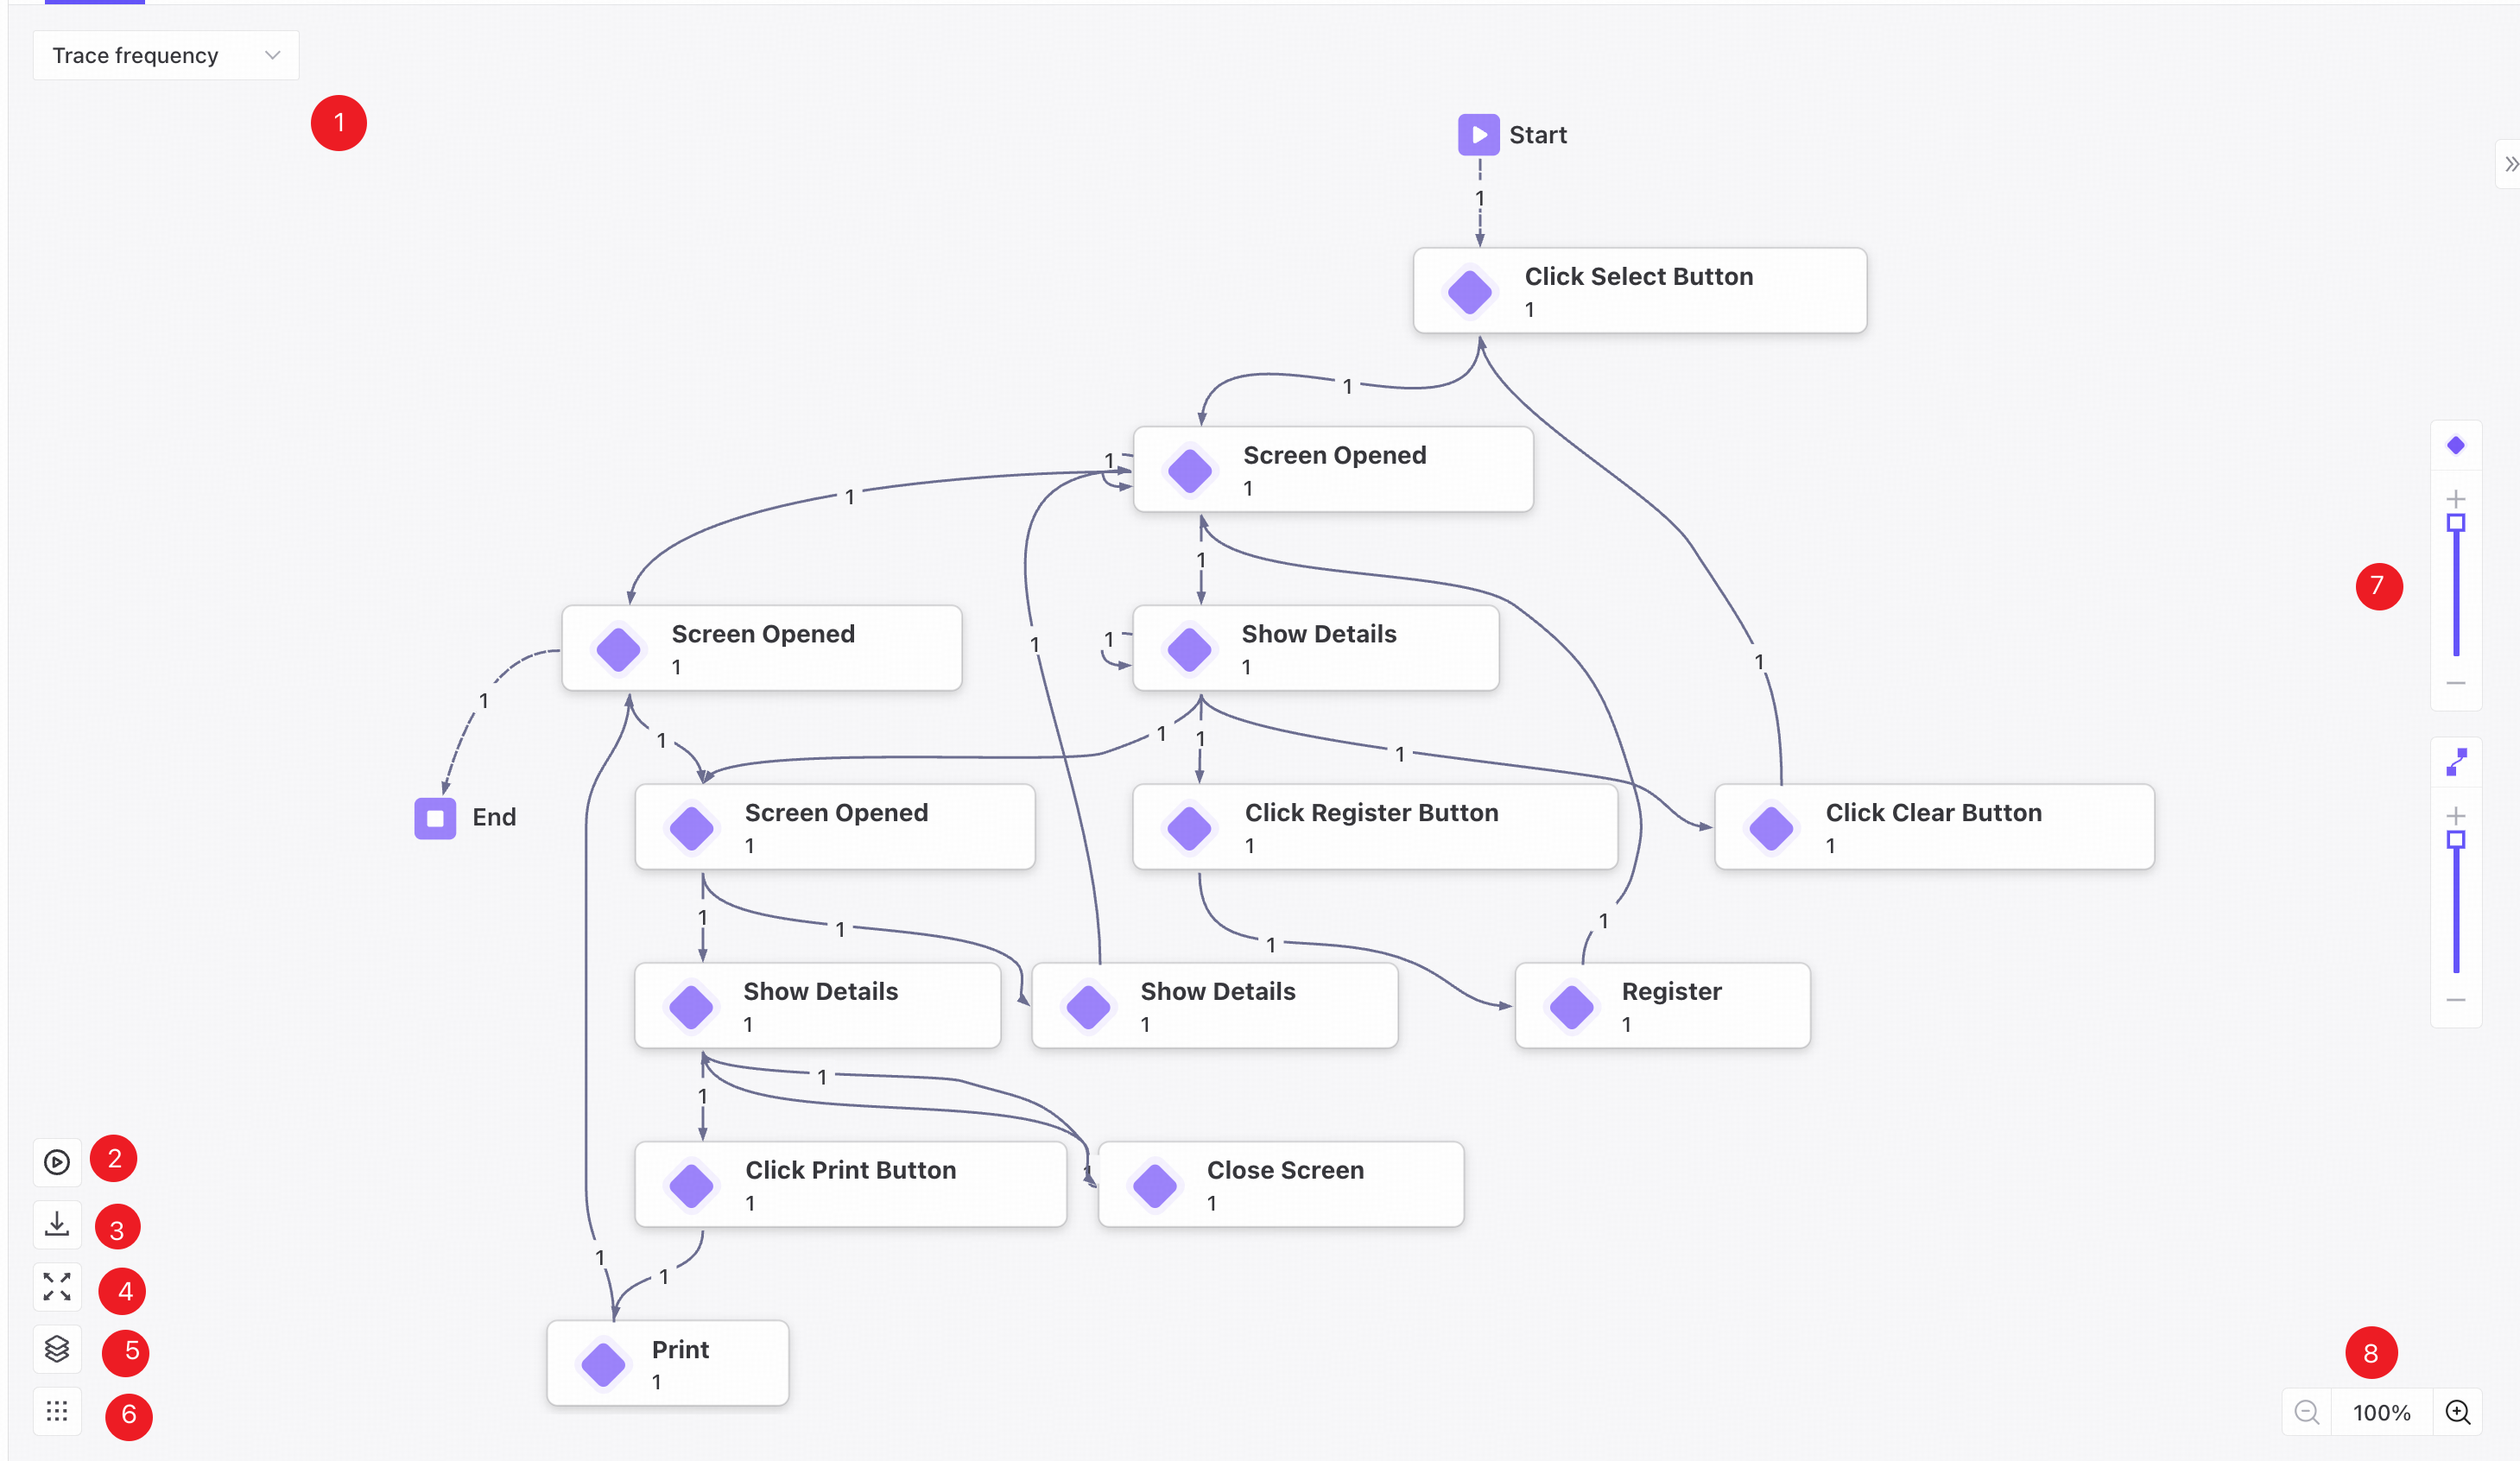
❶ Switch the map between trace frequency, action frequency, and throughput time.
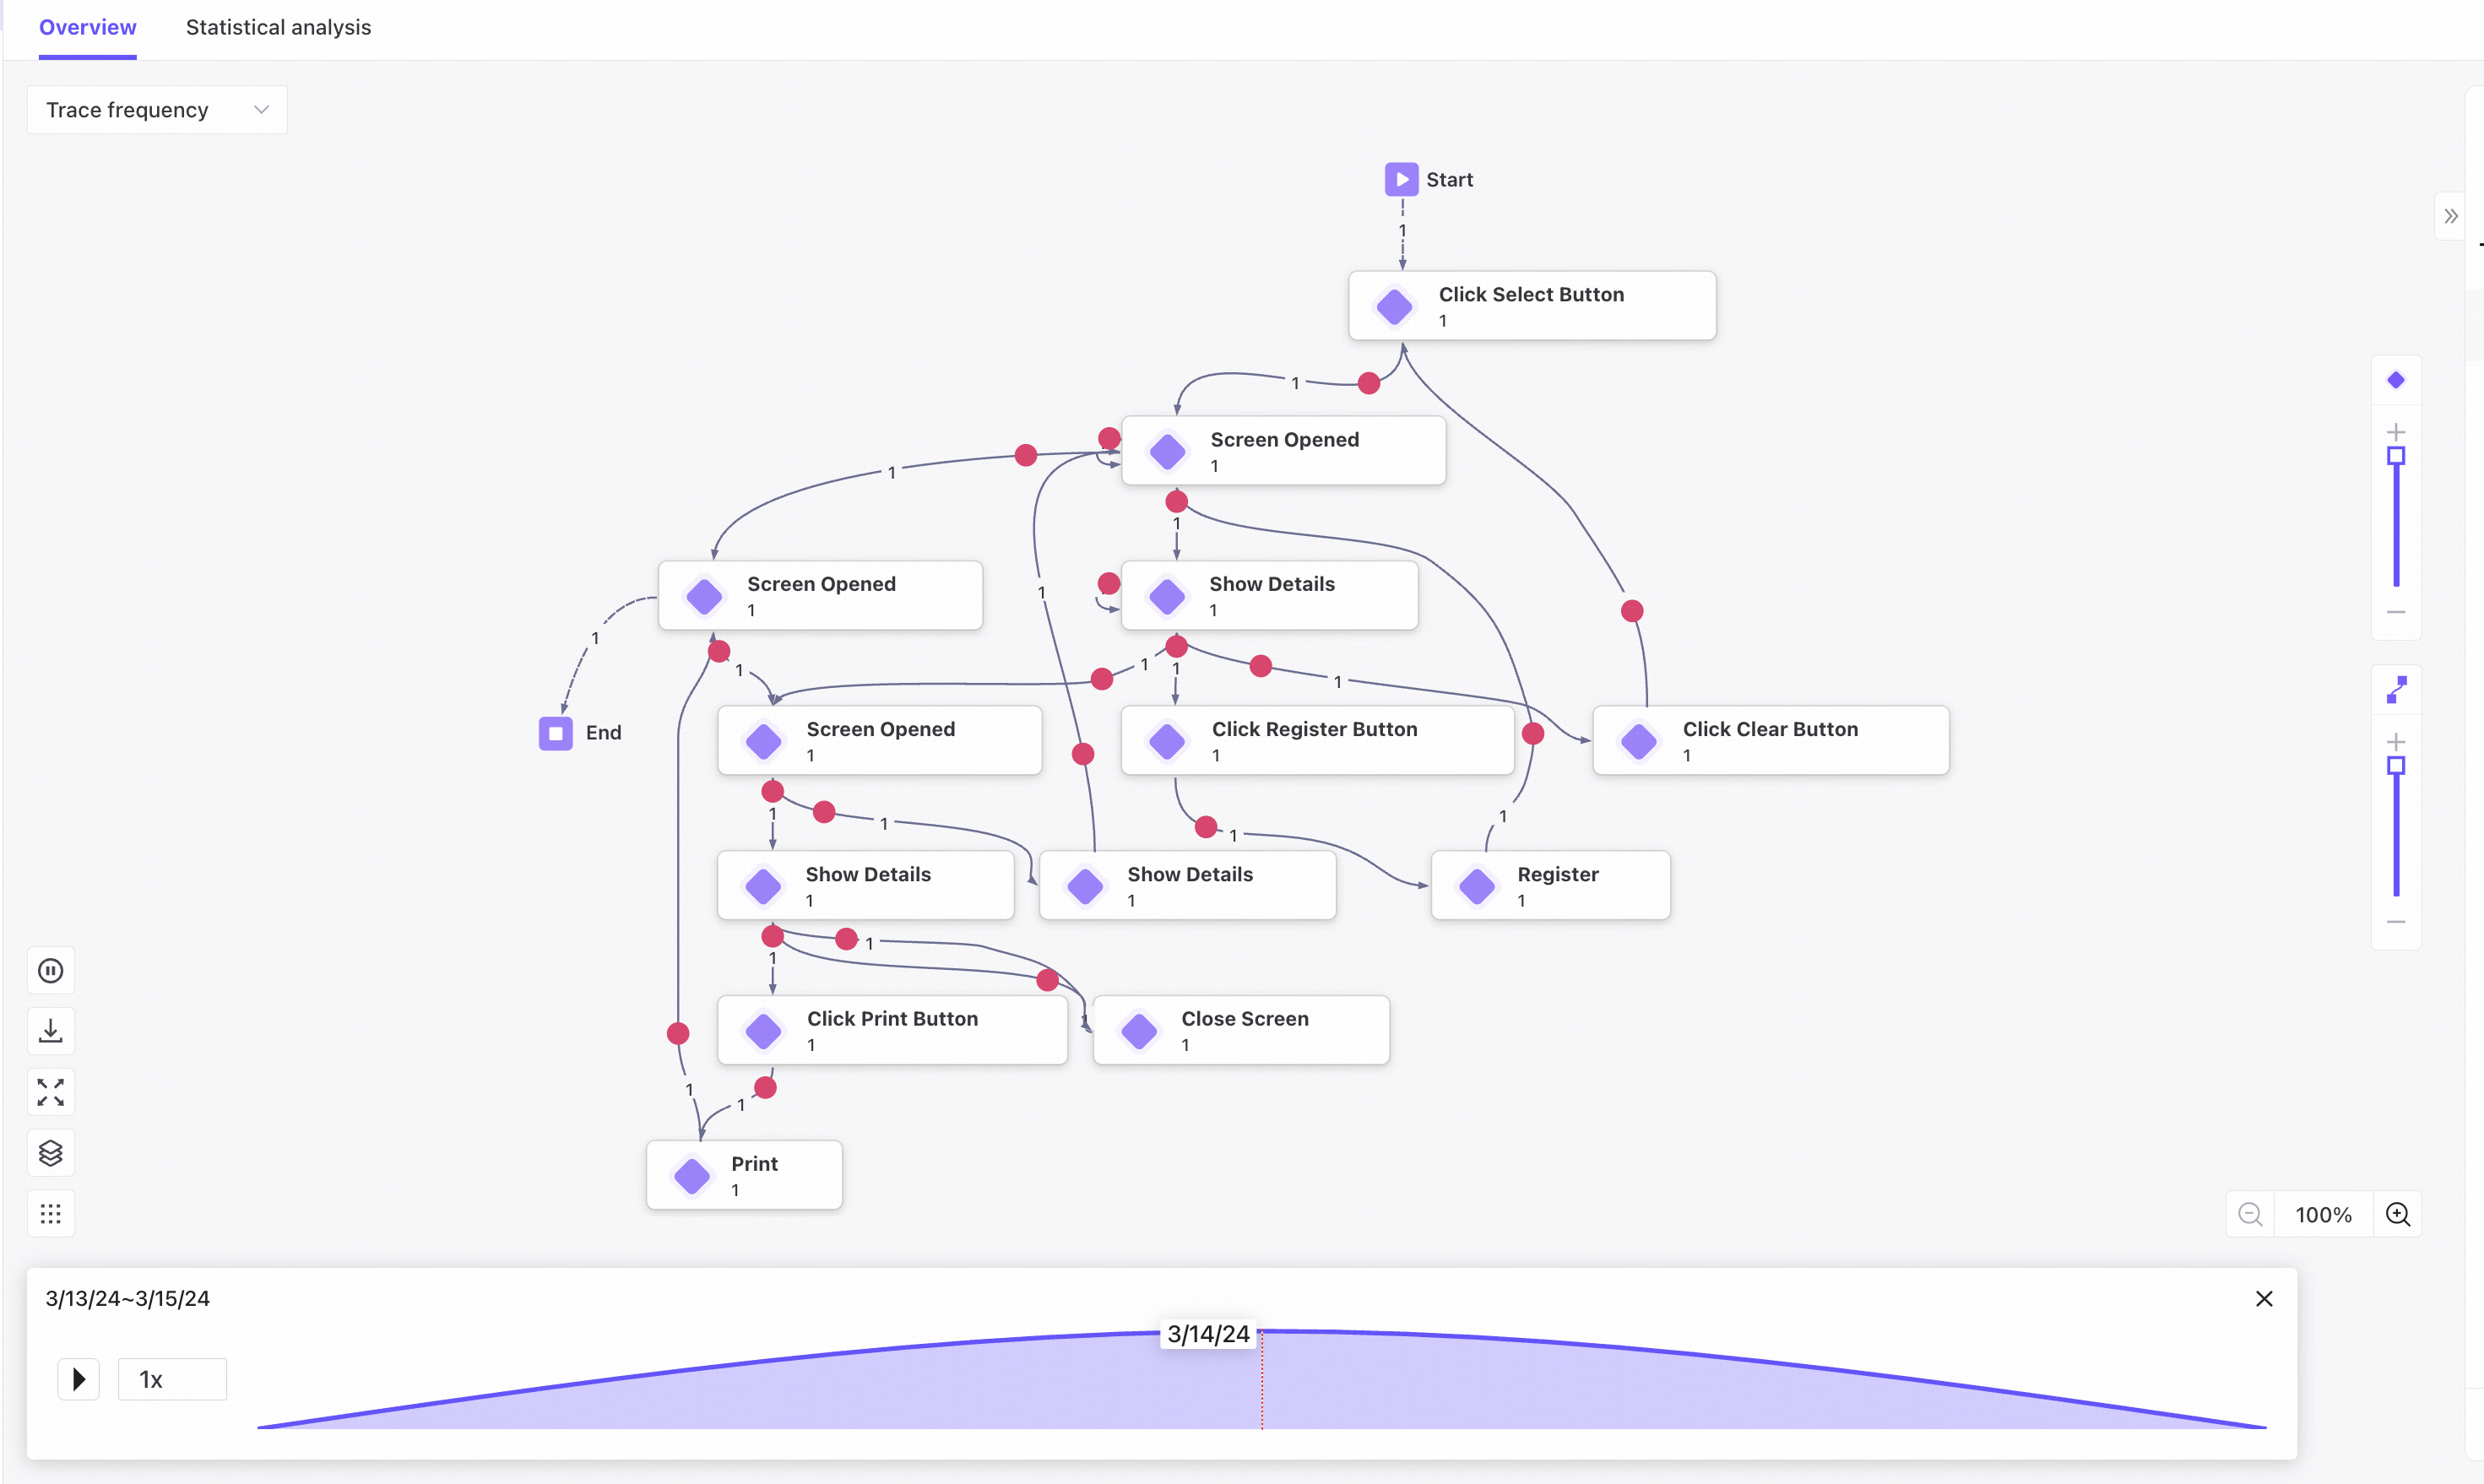
❷ Play the action flow animation. Each red bubble represents one trace and shows its actions.
❸ Export the current map as SVG.
❹ Display the map in full screen.
❺ Show the map legend.
❻ Switch the map background.
❼ Drag the complexity sliders to adjust the action nodes and edges displayed.
❽ Zoom from 100% to 400%.
Action and edge details
Action details
Click an action node to view its details.
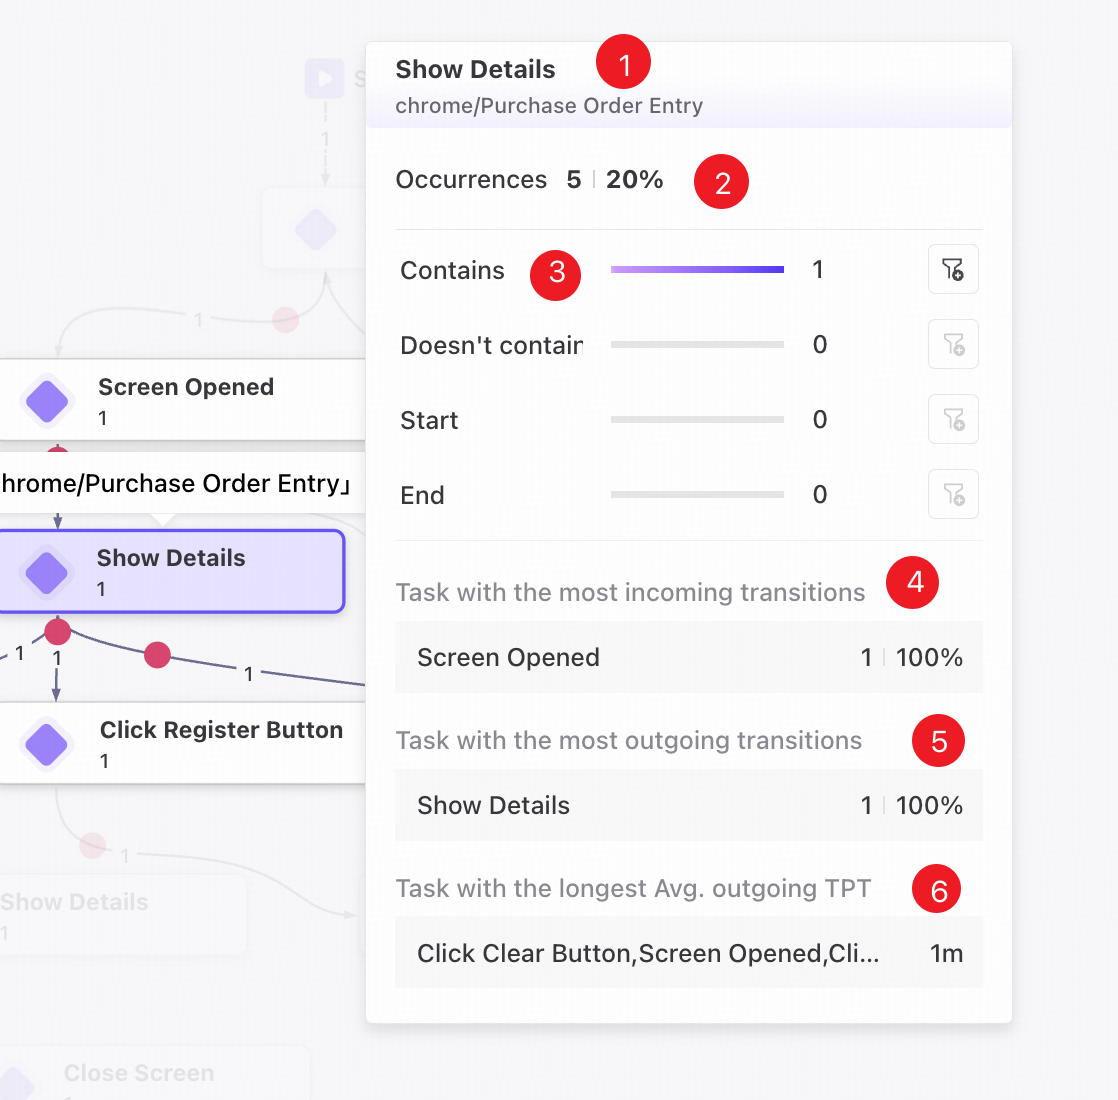
❶ Action name.
❷ Frequency and percentage of occurrences.
❸ Trace counts including or excluding the action, and starting or ending with it.
❹ The action with the most incoming transitions.
❺ The action with the most outgoing transitions from this action.
❻ The outgoing action with the longest average throughput time.
Edge details
Click a connection between action nodes to view its edge details.
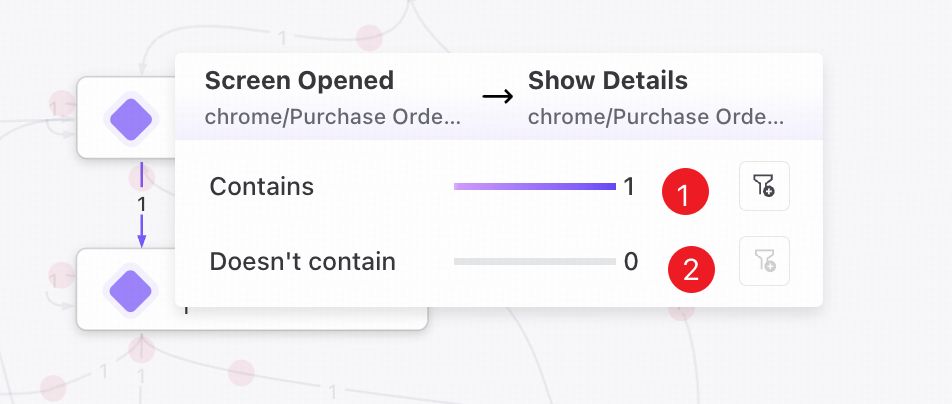
❶ Number of traces including the edge.
❷ Number of traces excluding the edge.
Click the filter icon on the right to add the edge as a filter condition.
Trace list
View basic information about each trace.
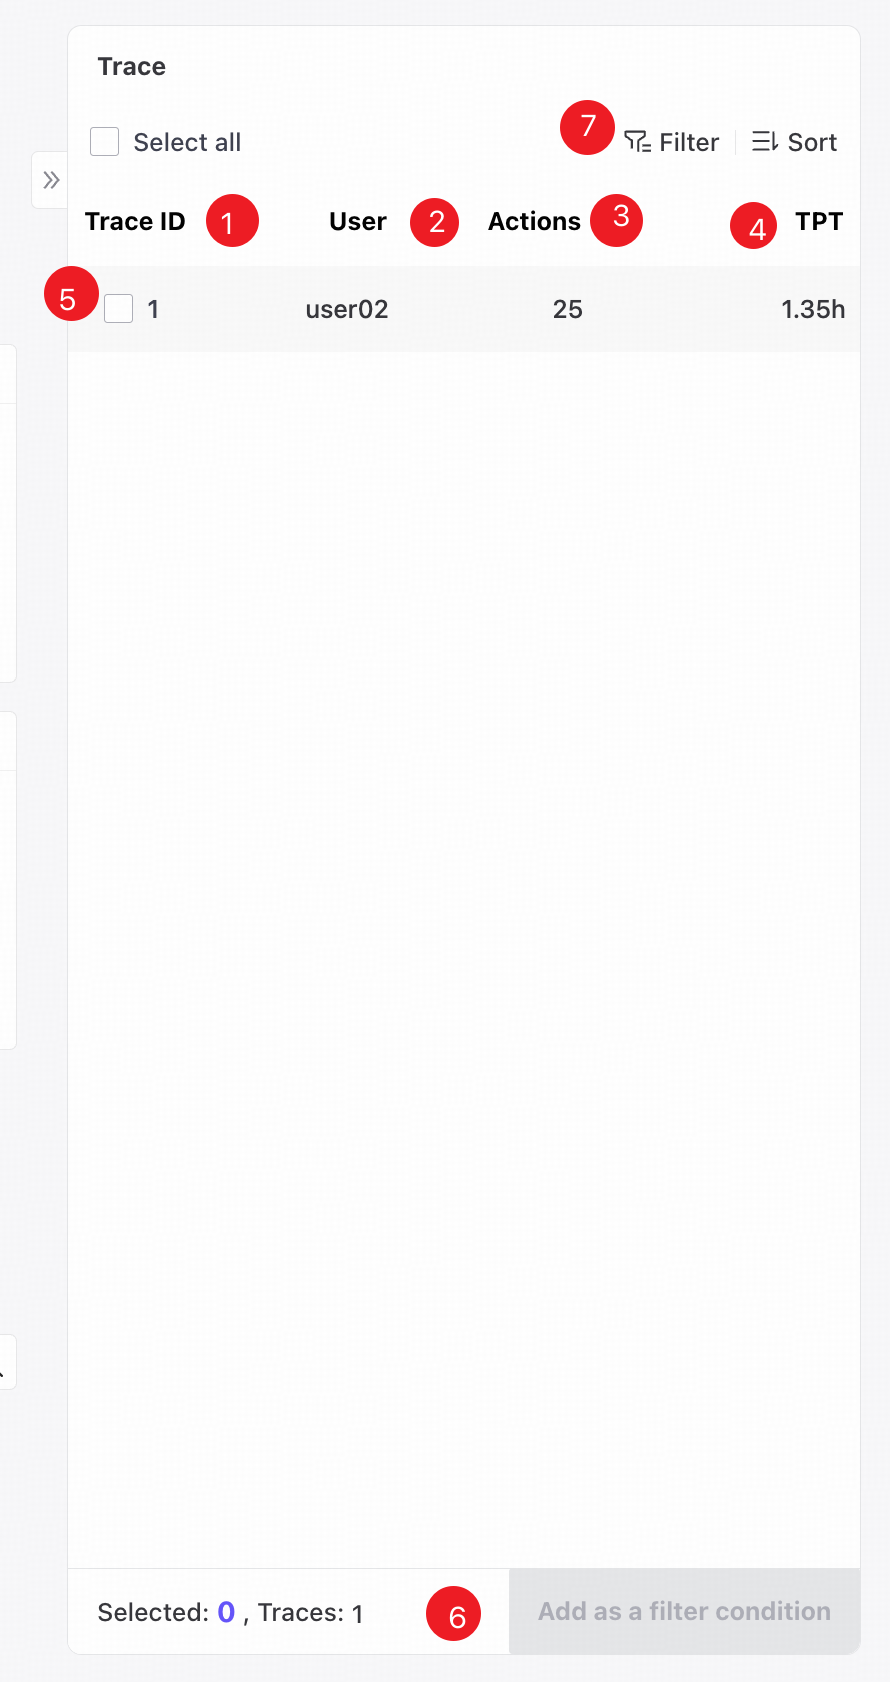
❶ Trace ID.
❷ User.
❸ Number of actions in the trace.
❹ Trace throughput time.
❺ Select individual traces or select all using the checkboxes.
❻ Add selected traces as filter conditions.
❼ Filter or sort displayed data by specific conditions.