Process overview
After the OCPM model is generated, Overview opens with basic information about the current process.
Process map
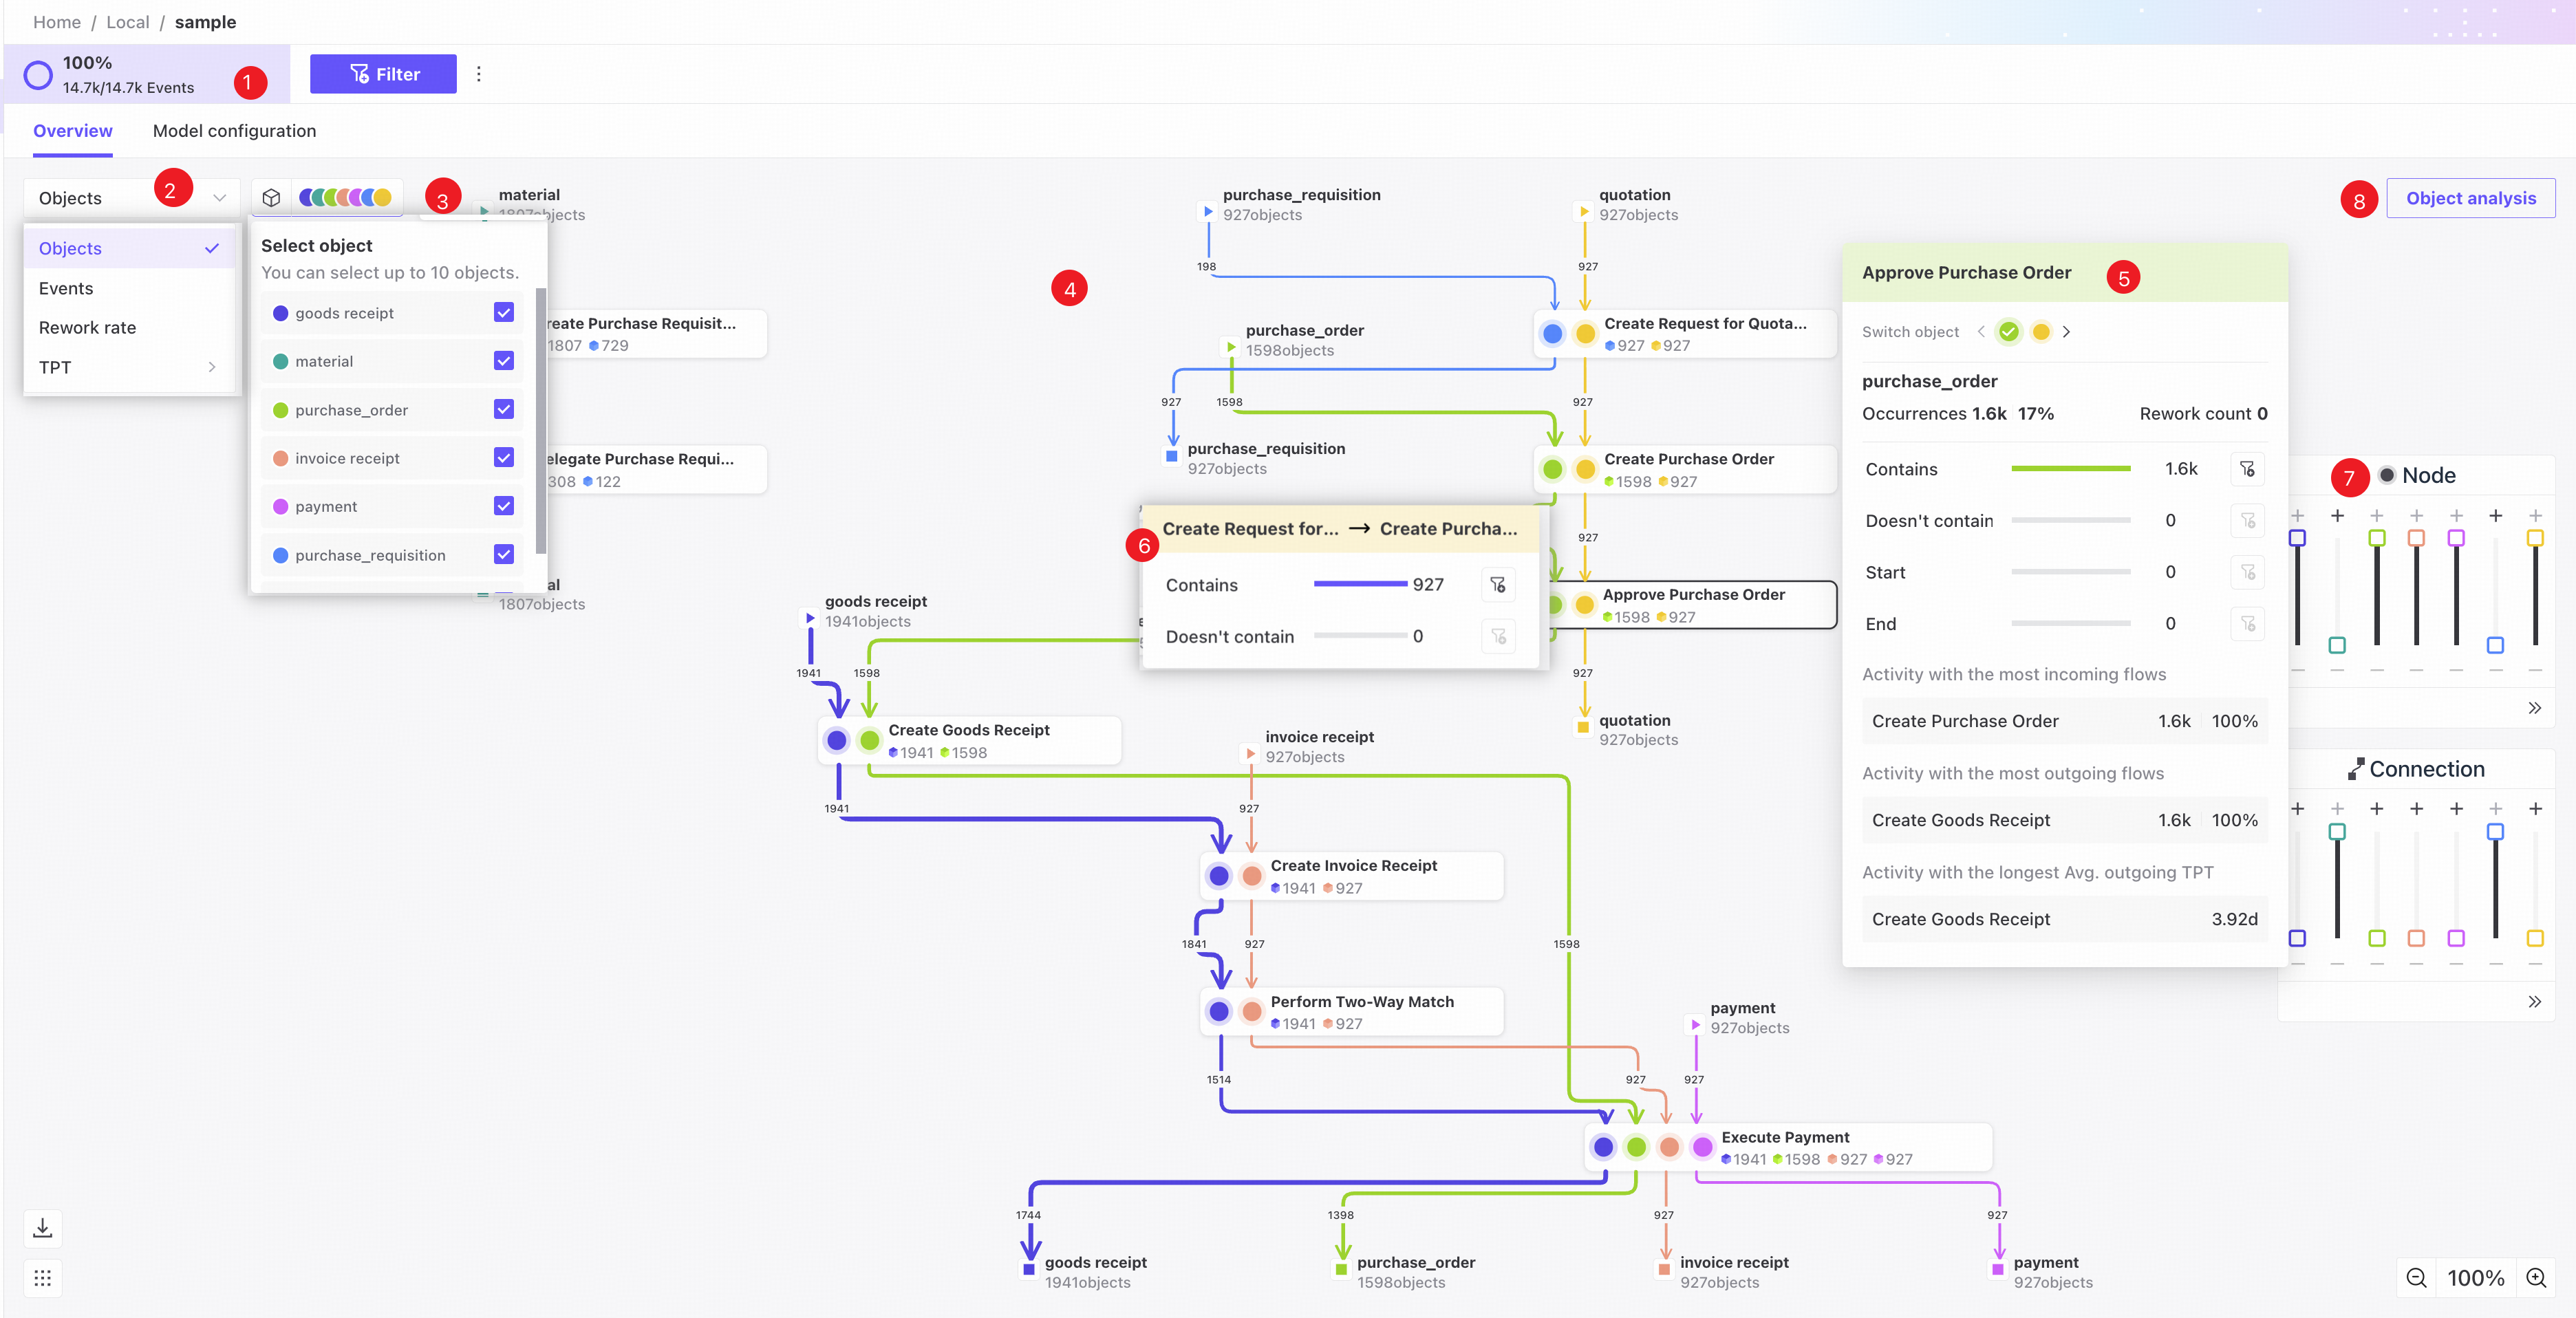
❶ KPI area: filtered event count and total event count.
❷ Switch the core measure displayed on the process map.
❸ Object selection: colored bubbles identify the displayed objects. Click to select up to 10 objects.
Select at least one object to display.
Objects without event relationships cannot be selected.
❹ Process map area: selected objects' process flows are shown in different colors.
❺ Click a node to see its details. At shared nodes, switch objects to inspect the node in each object's process flow.
❻ Click an edge to see its details.
❼ Adjust complexity for the entire process or for one object's process flow individually.
❽ Click Object analysis to open the object analysis list.
Object analysis
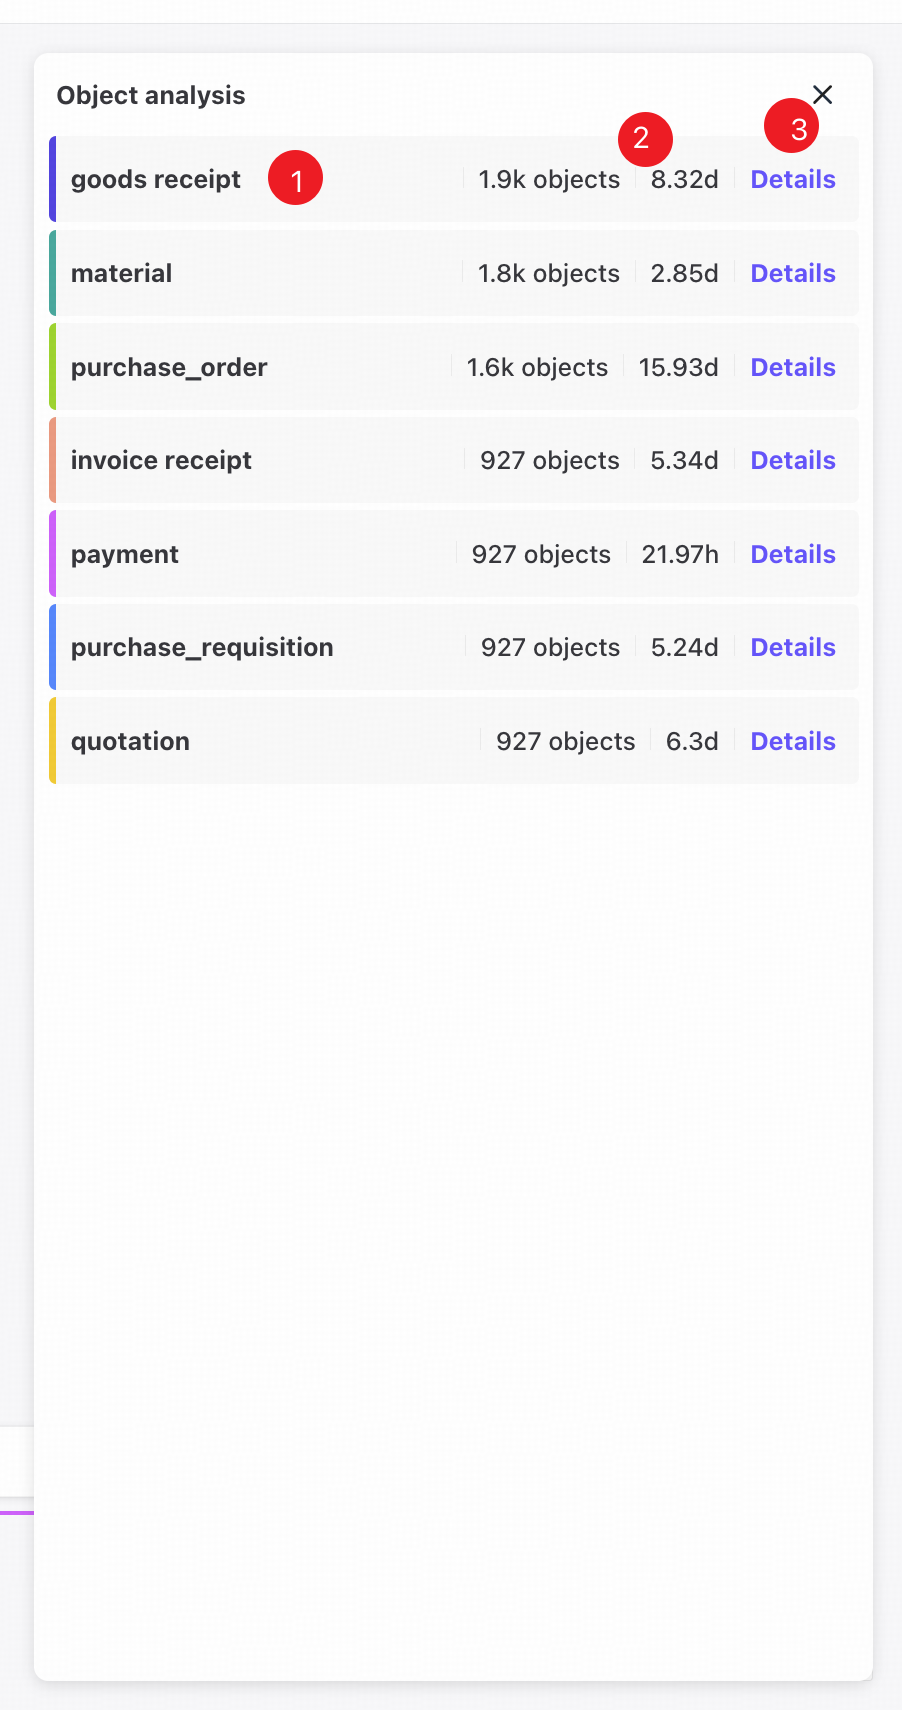
❶ All currently selected objects.
❷ Object instance count and average throughput time for each object type.
❸ Click Details to open object details.
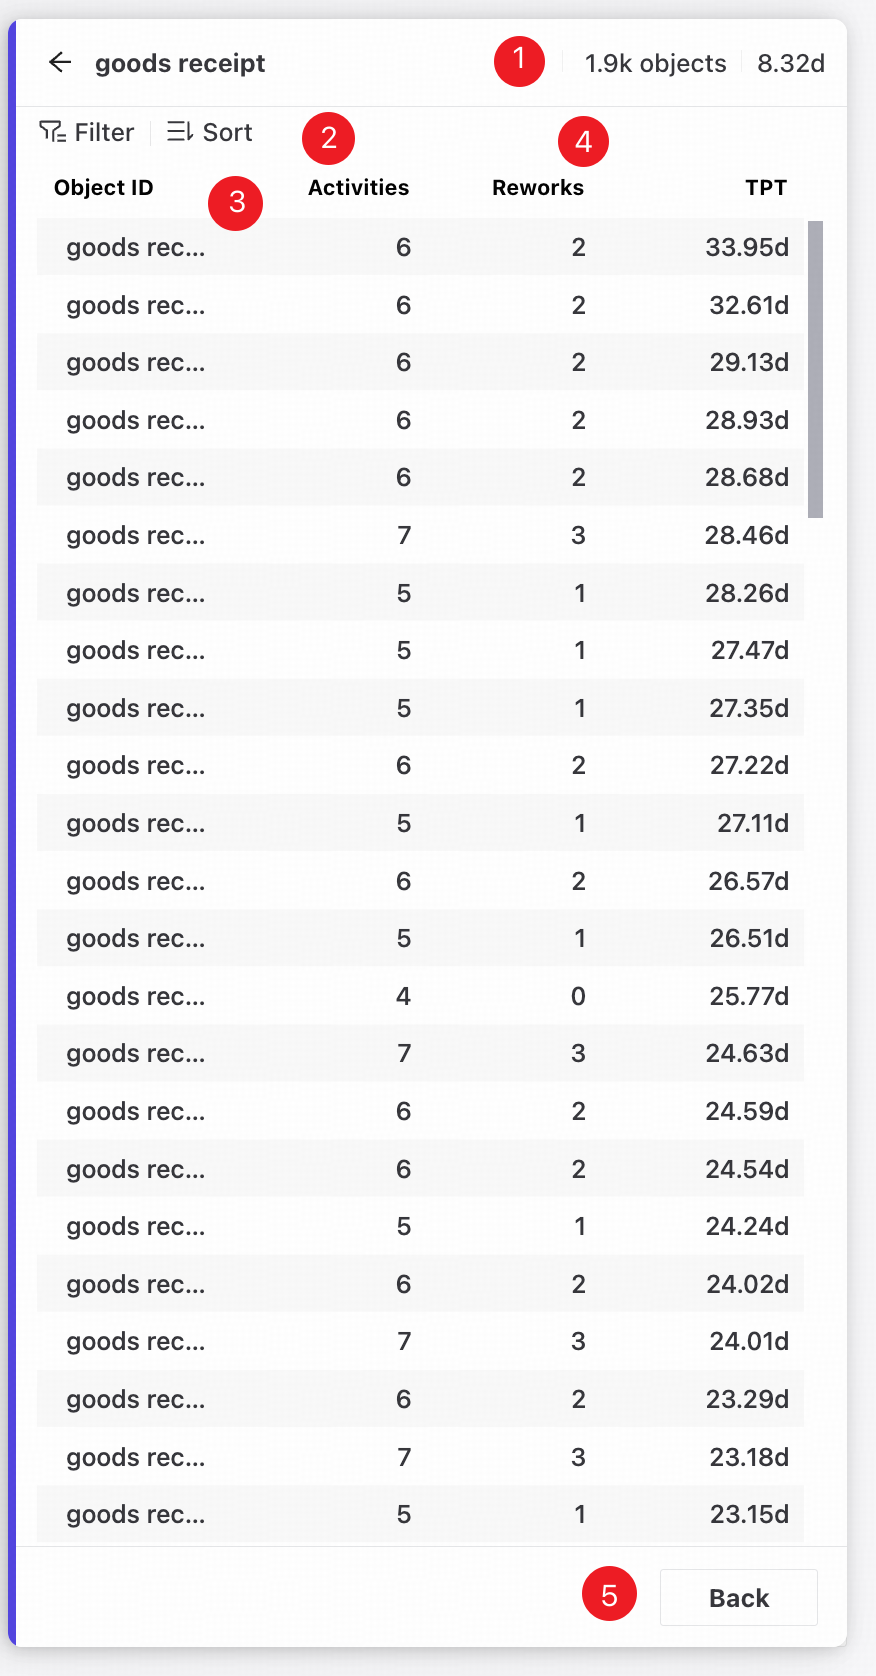
❶ Object name, instance count, and average throughput time.
❷ Filtering and sorting.
❸ Object ID: each row identifies one object instance uniquely.
❹ Activity count, rework count, and actual throughput time for the object instance.
❺ Click Back to return to the object analysis list.