Create an insight
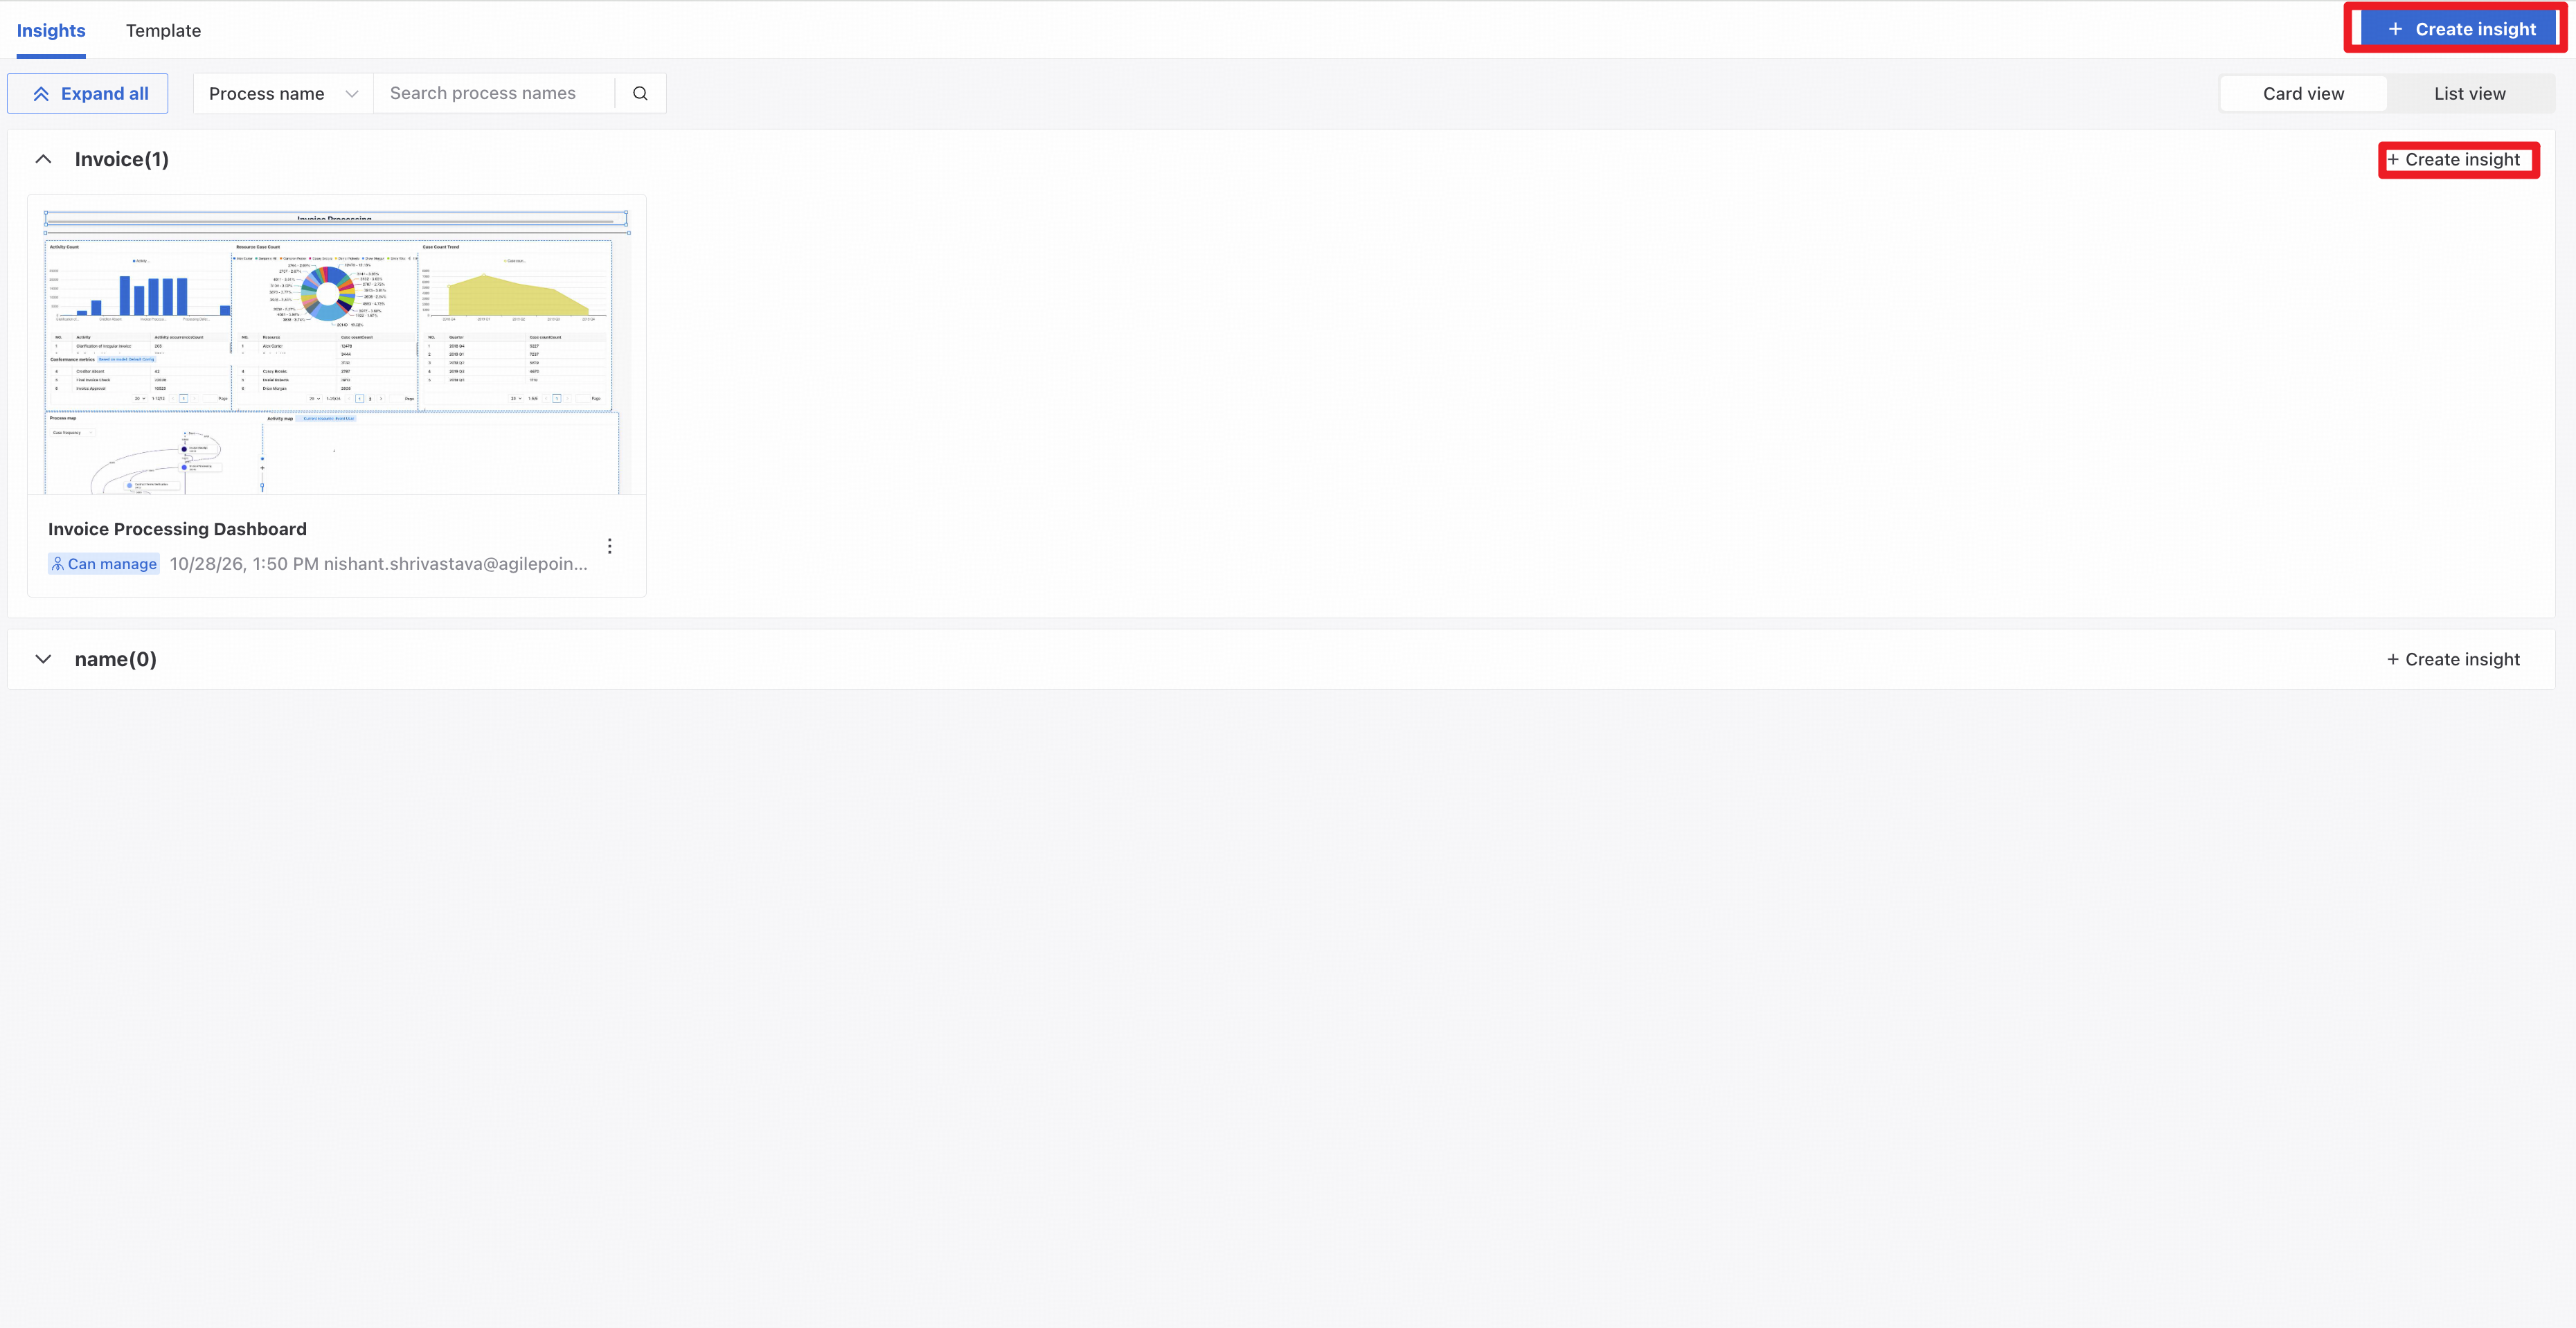
Click New insight in the upper-right corner of the main page or within a process section to create an insight.
The insight editor opens as shown below.
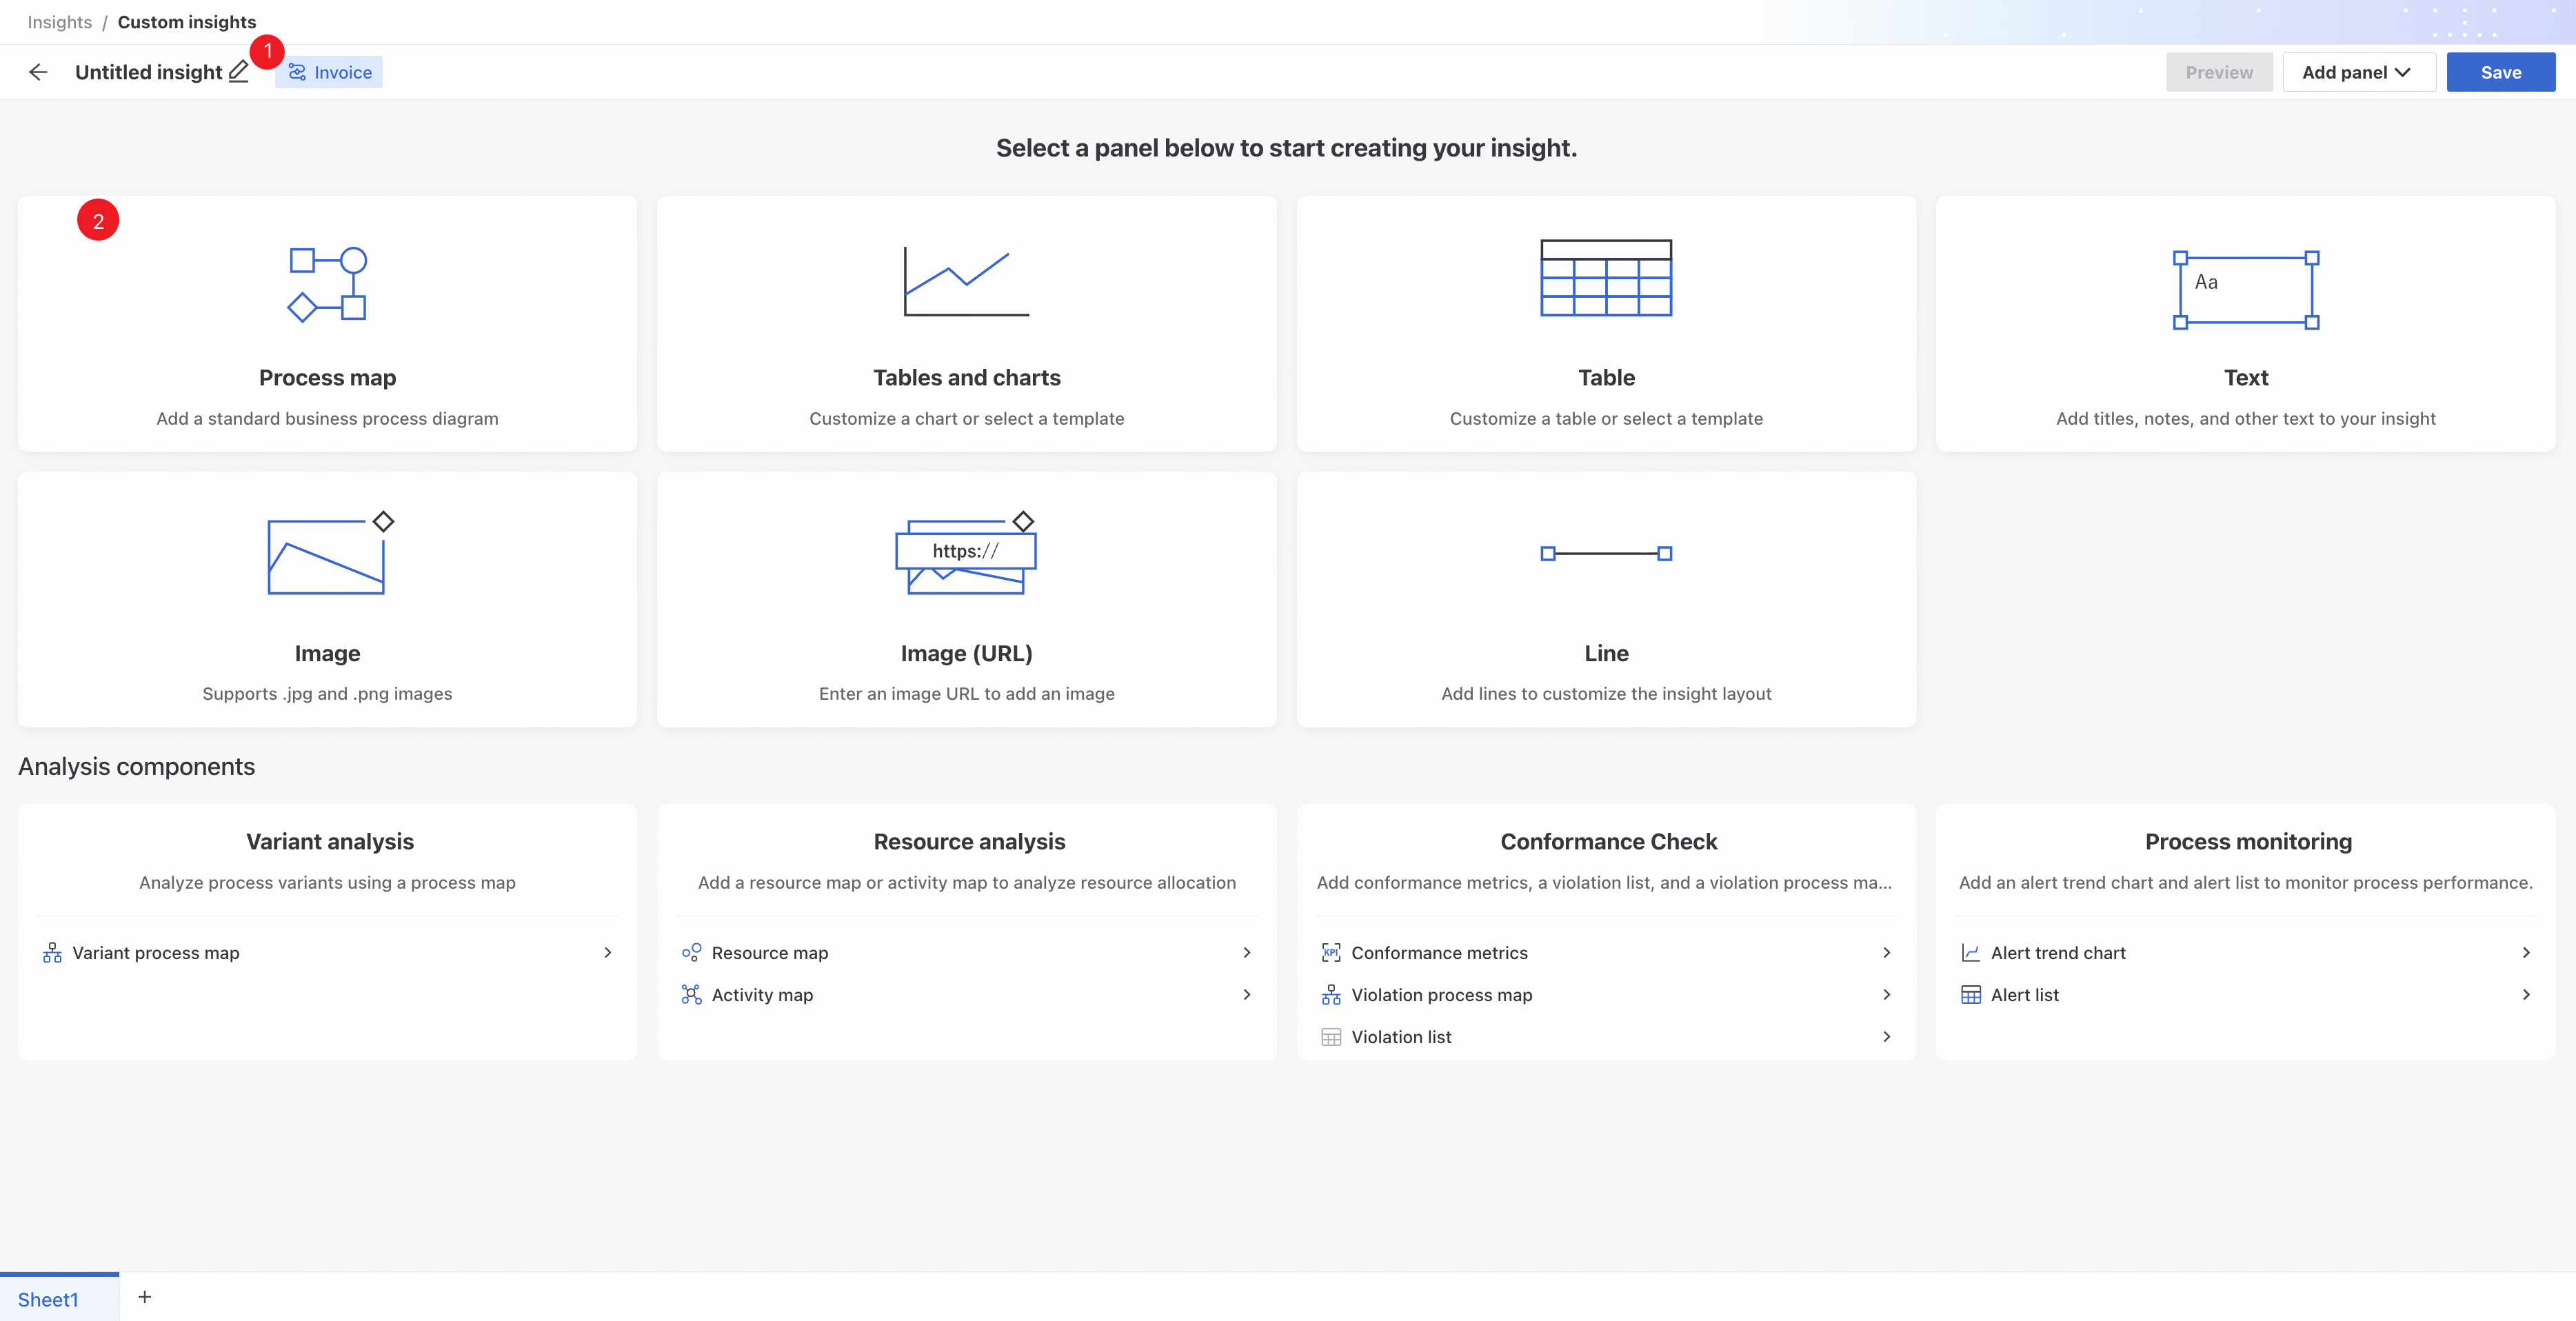
❶ Edit the insight name.
❷ Add a panel by clicking a card or using the dropdown in the upper-right corner.
Panel selection cards appear only when the insight is empty. After adding panels, drag them to arrange the layout.
- Process map: add the current process map. You can zoom, switch dimensions, and increase complexity.
- Text
Add a text box containing custom text.
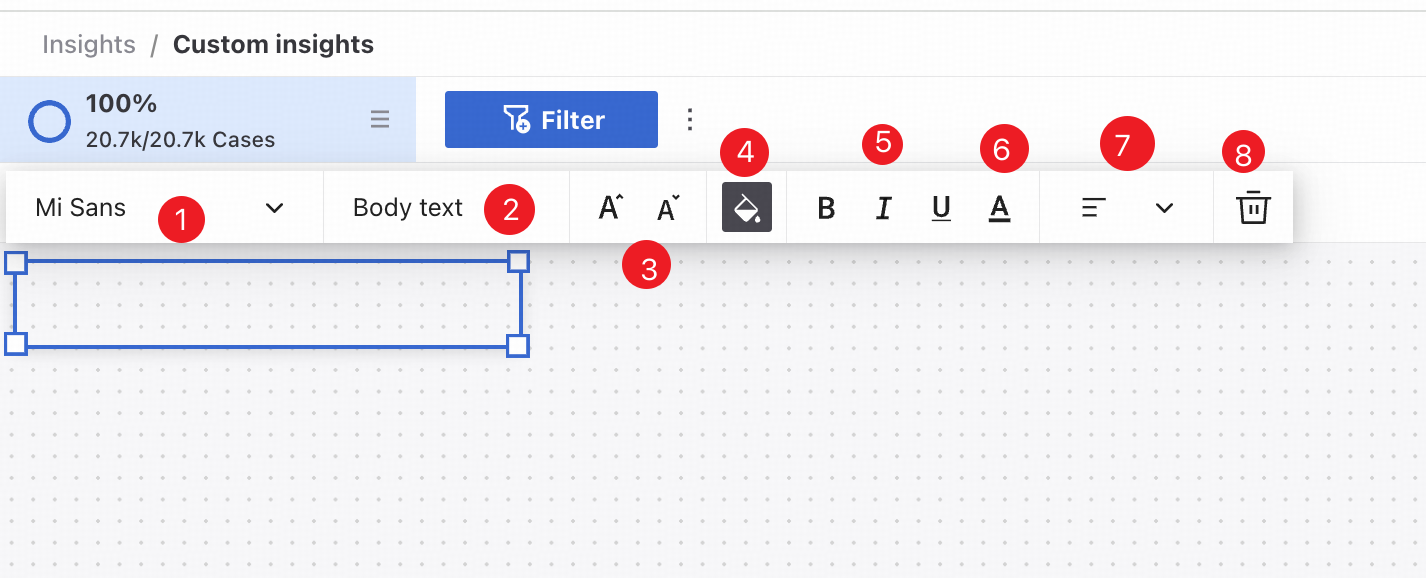
❶ Font selection.
❷ Font size selection.
❸ Increase or decrease font size.
❹ Text box background color.
❺ Bold, italic, and underline controls.
❻ Text color.
❼ Text alignment.
❽ Delete the text box.
- Image
Select an image from your computer or enter an image URL to add it. Drag to resize it. Hover to configure the border or delete the image. - Line
Add a line and change its color, style, thickness, orientation, or arrowheads. Click Delete to remove it. - Tables and charts
Click Tables and charts to open chart creation. Select measures, dimensions, and a chart type, then generate the chart.
Click More to show the following analysis components: - Variant analysis
Add a variant process map component to the insight.
- Resource analysis
Add a Resource map or Activity map.
- Conformance Check
Add a conformance KPI panel, violation process map, or violation list. An active process model is required.
- Process monitoring
Add an alert trend chart or alert list. At least one enabled process monitor is required.
After an event log is imported, the system analyzes it and generates preset measures and dimensions. For details, see System presets.
Insight sheets
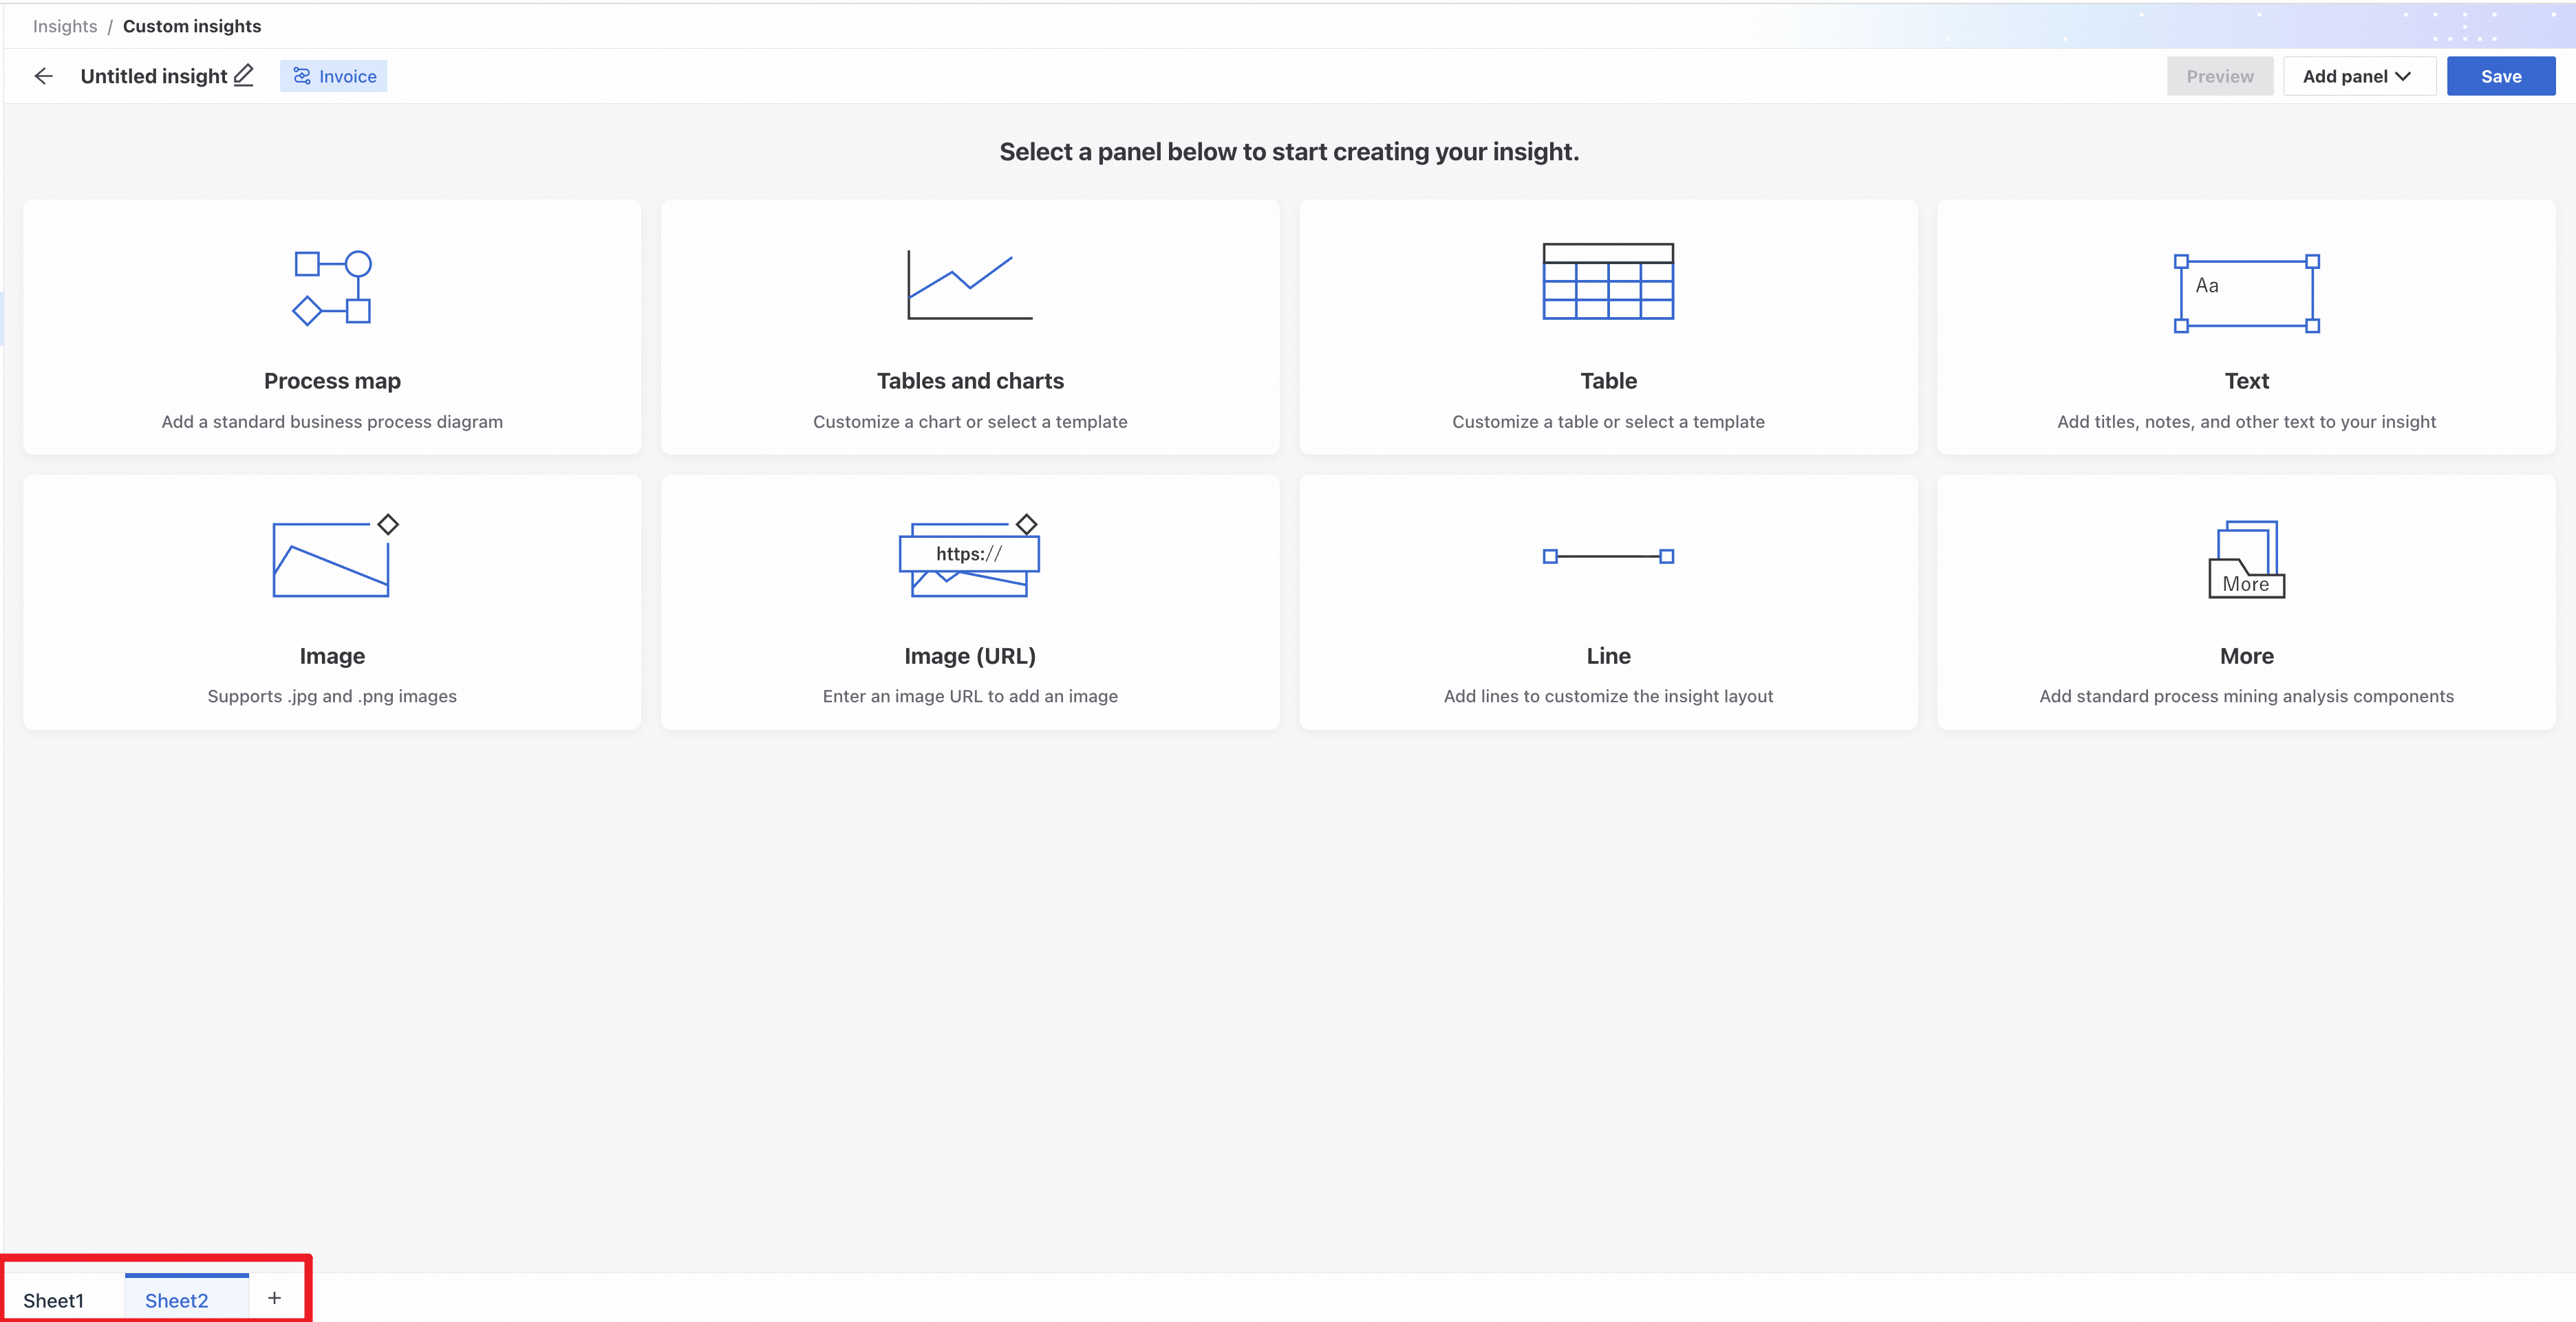
Add sheets to an existing insight. Each sheet is an independent canvas where you can freely add panel components.
- Click the plus button in the lower-right corner to add a sheet.
- Use the actions area to rename or delete a sheet. Sheet names must be unique.
Filters
Global filters
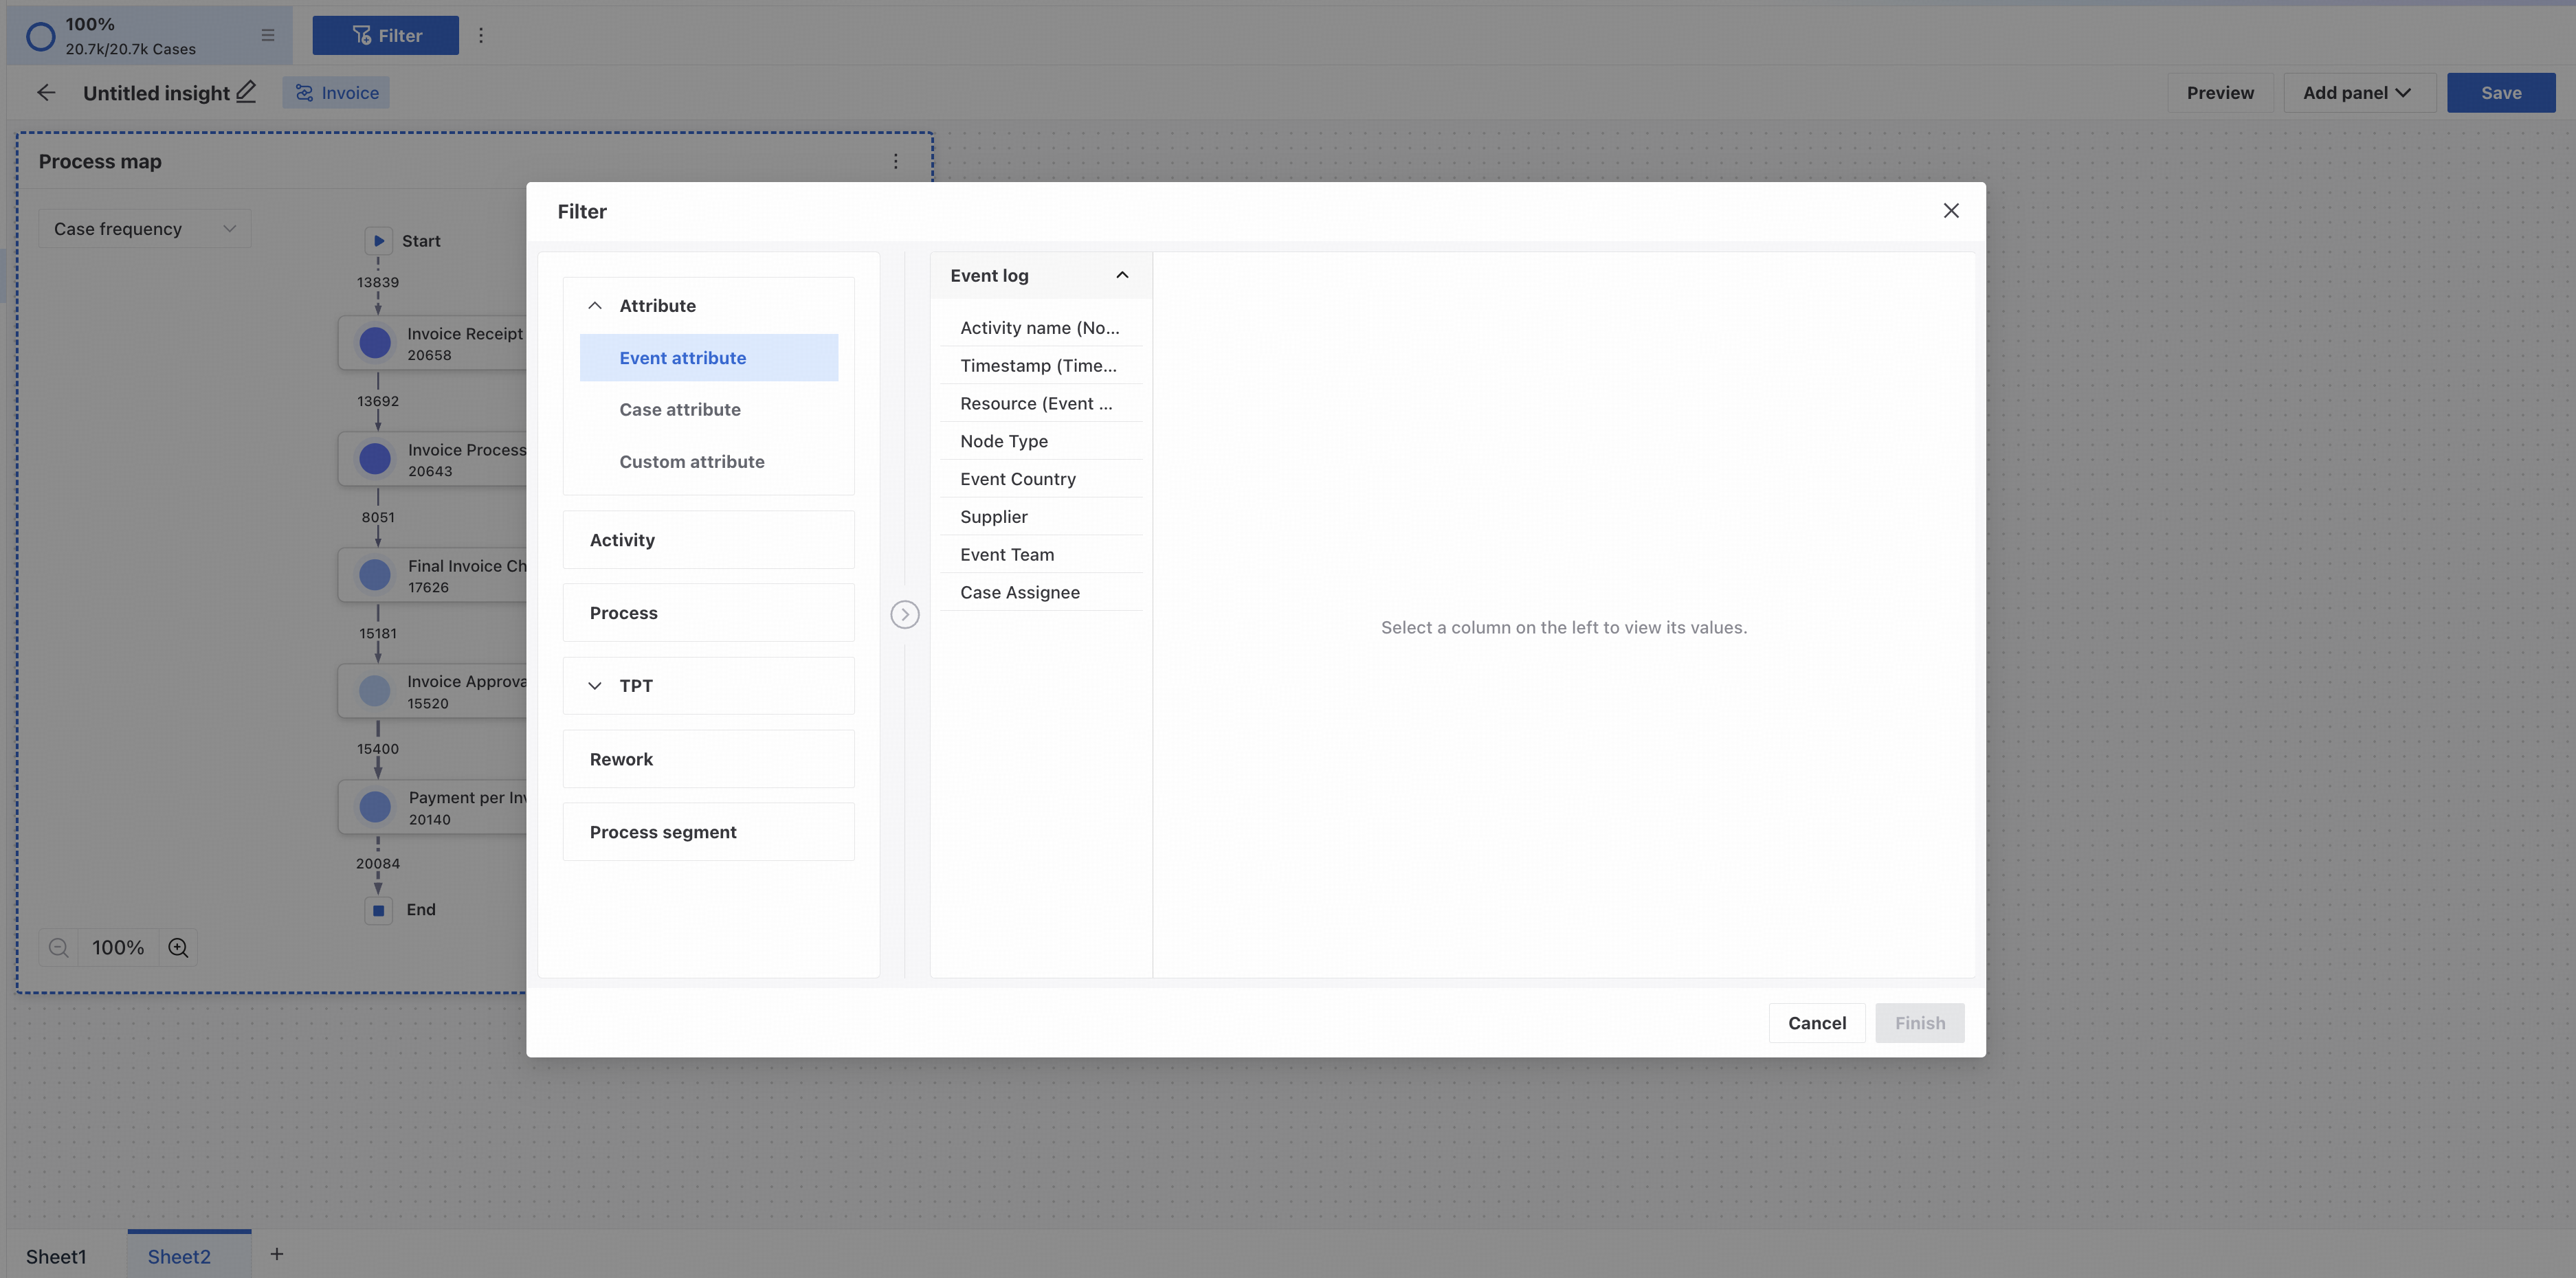
Insights supports global filters.
Click Filter conditions at the top to add filters to the current insight. They apply to all sheets in the insight.
For instructions, see Filter conditions.
Add filters from process maps
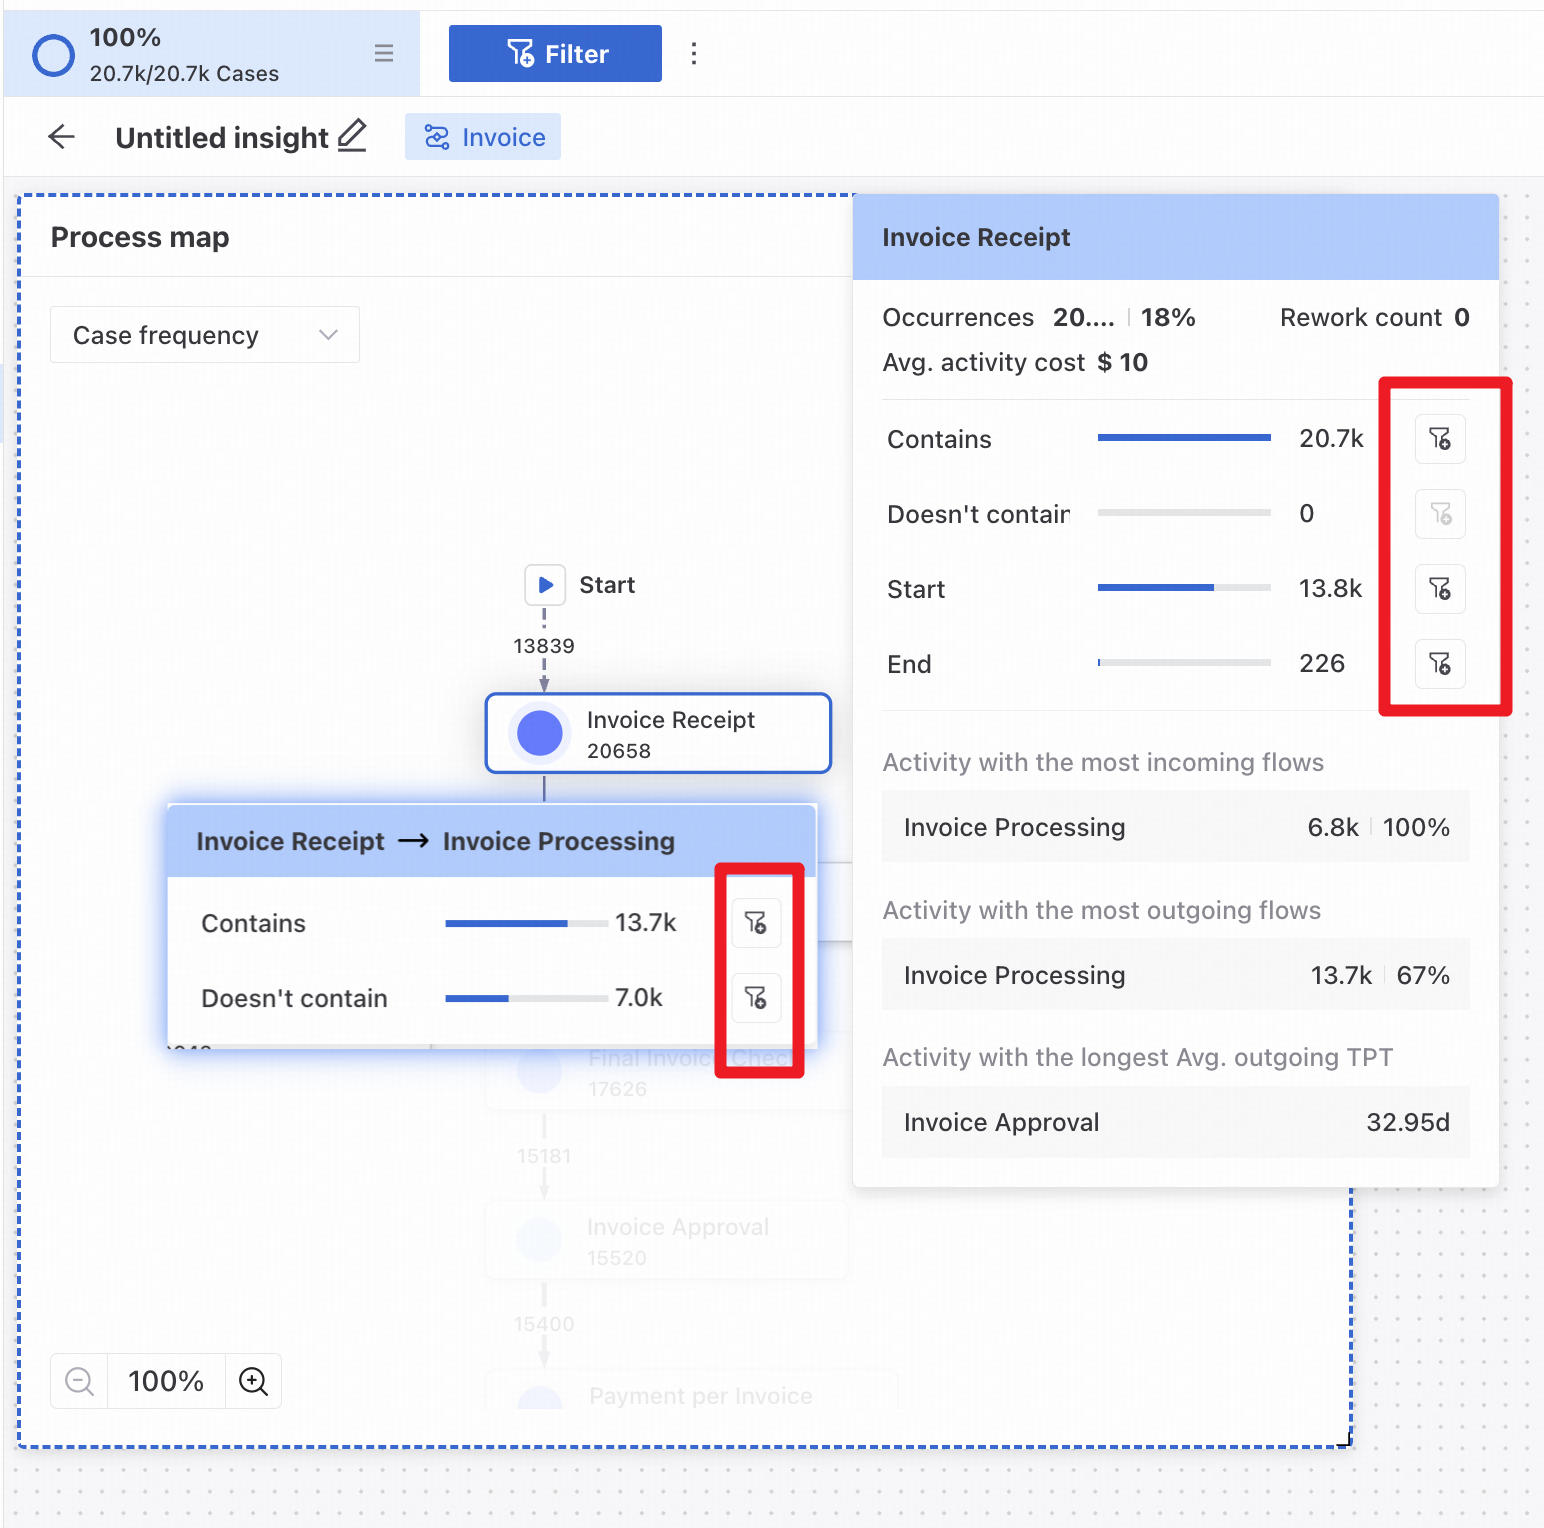
After adding a Process map panel, click nodes or edges to add filters quickly. For instructions, see Process map.
Add filters from tables
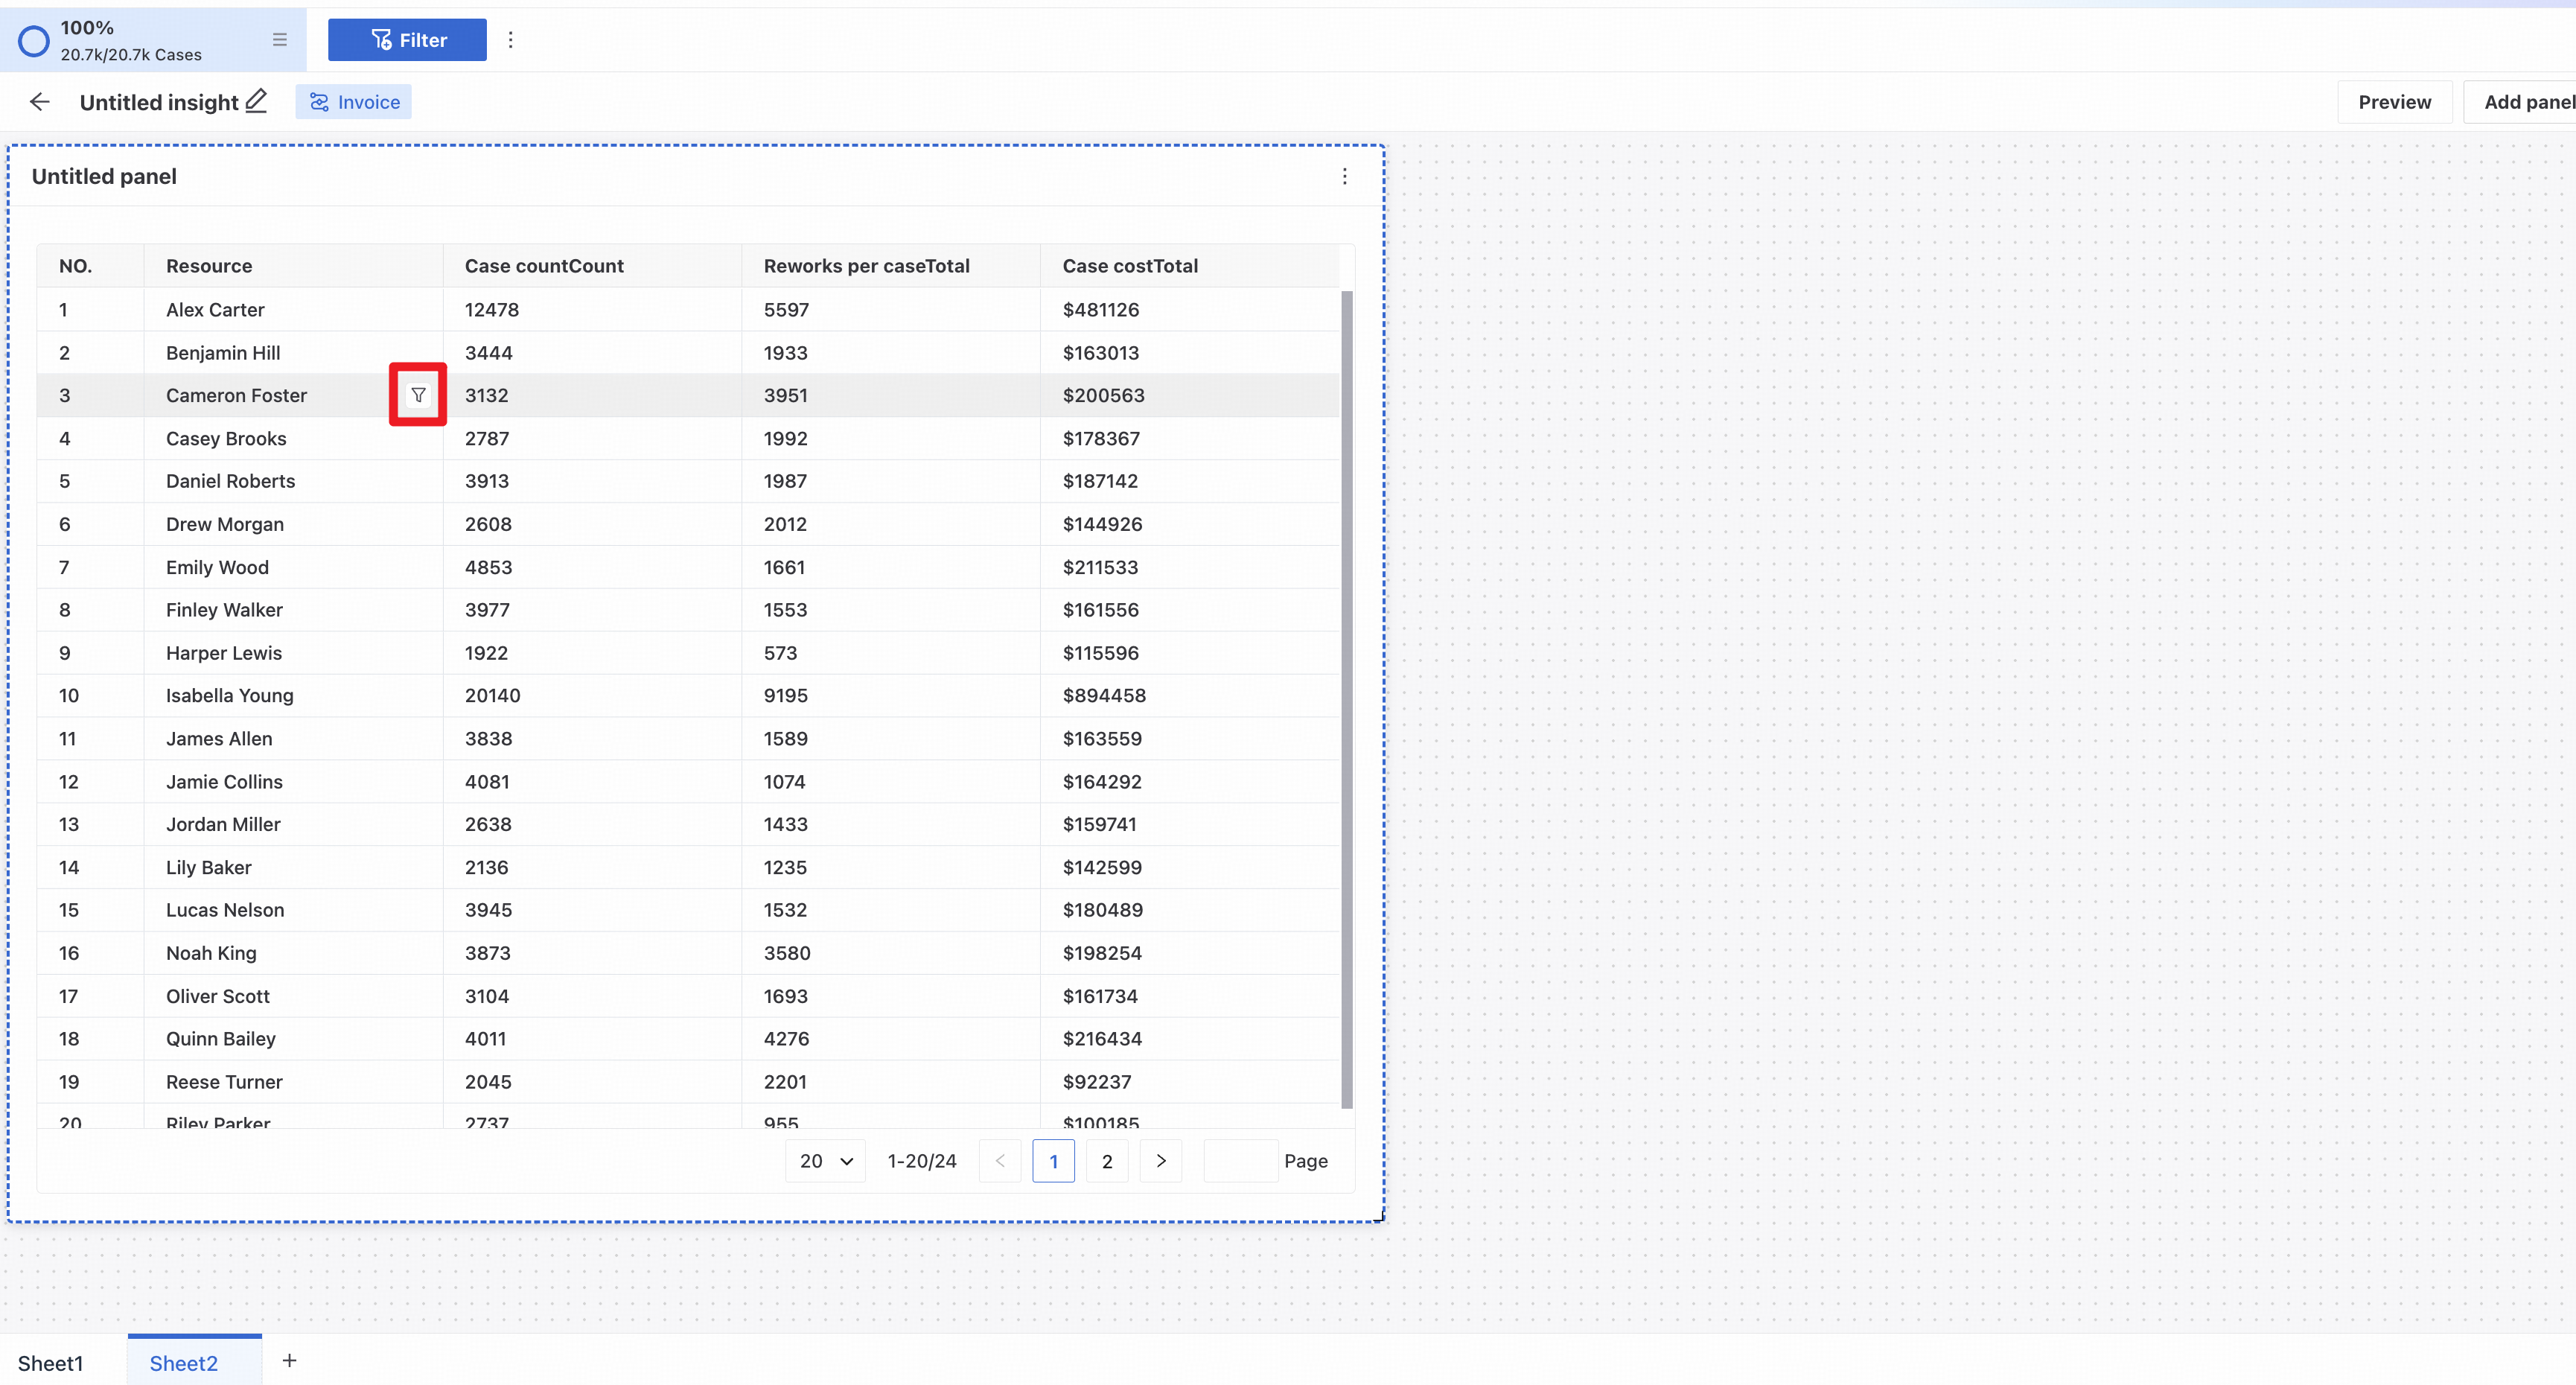
After adding a Table panel, click dimension values to add them as global filter conditions.
Filter components
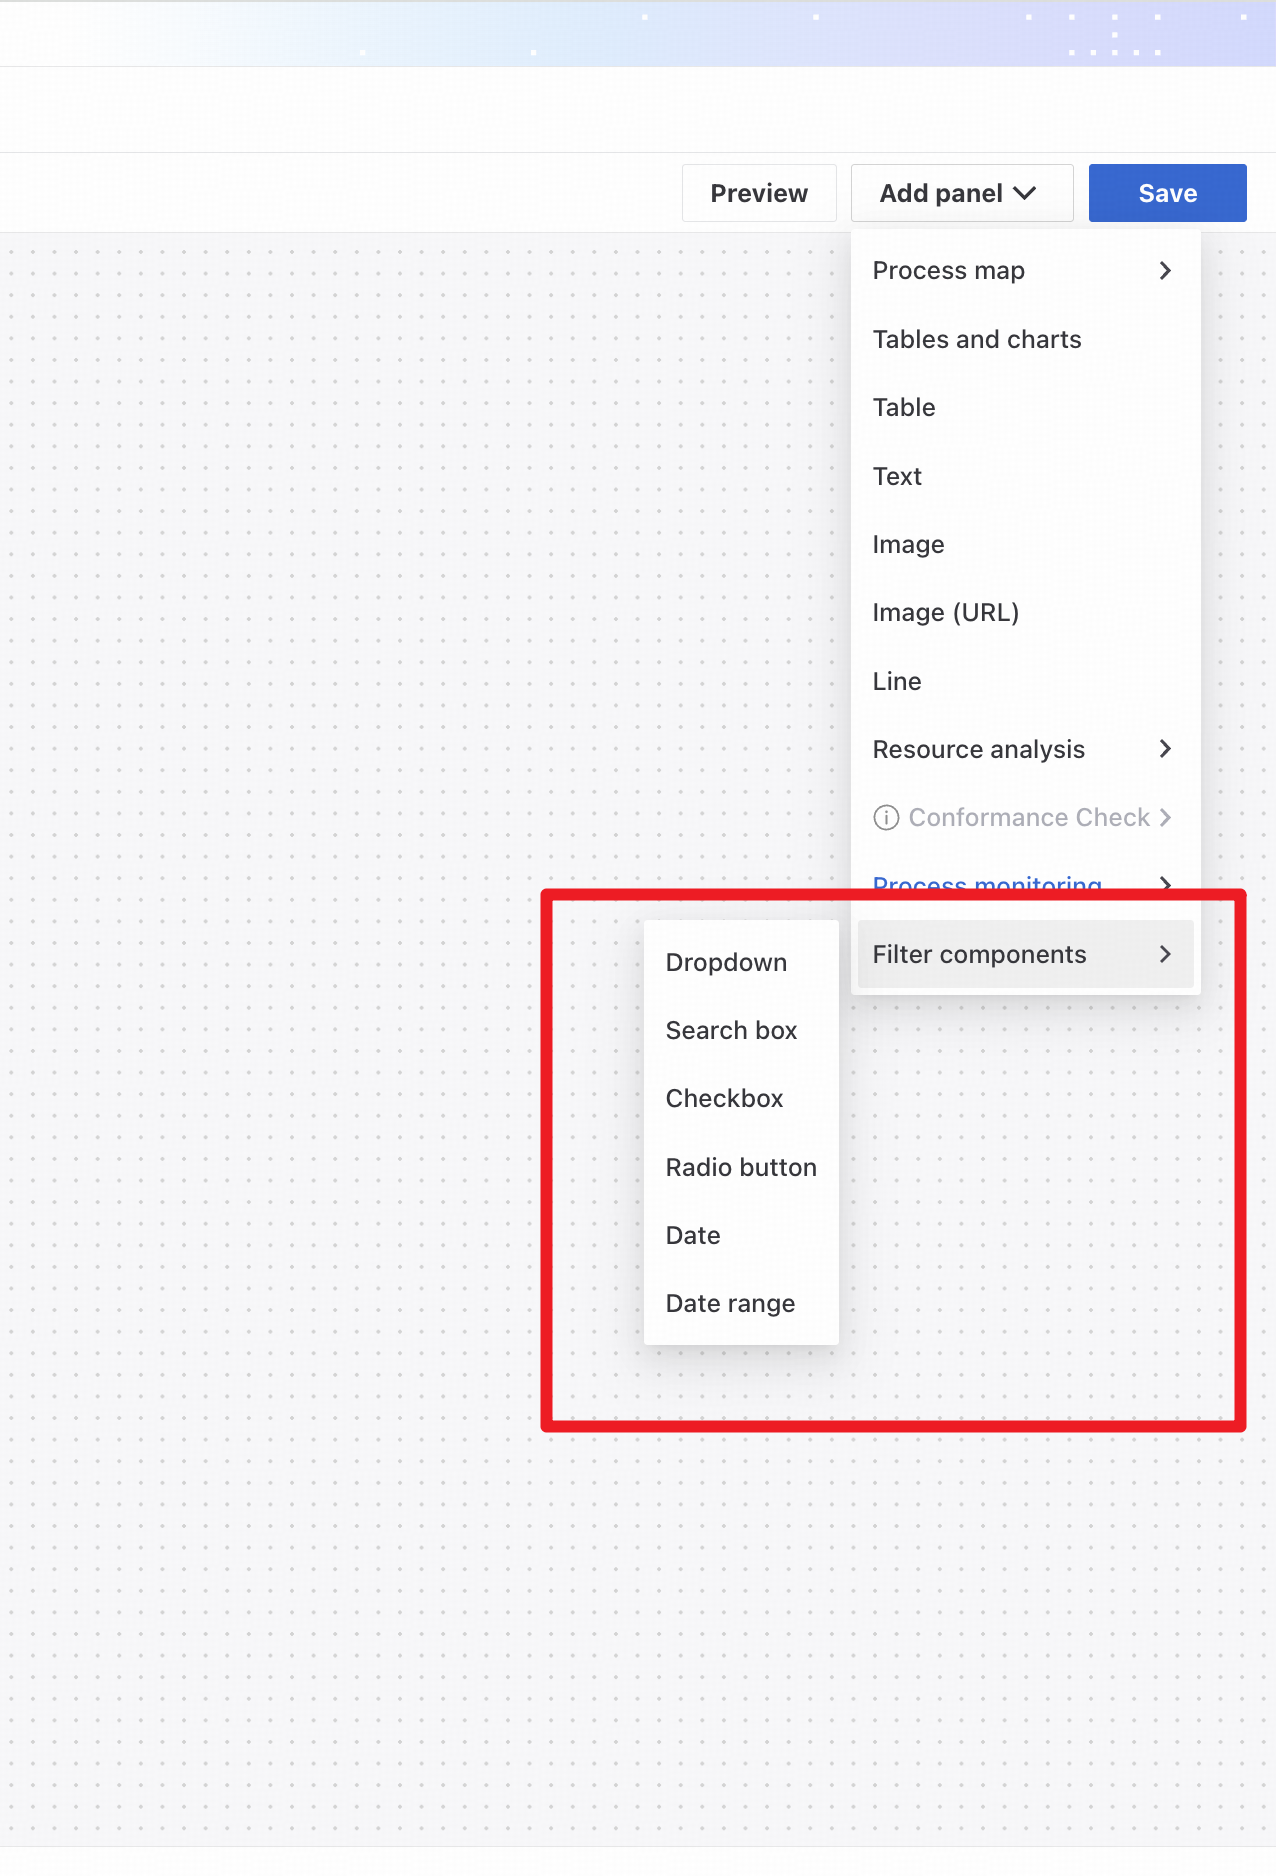
Add different types of filter components to filter chart results.
Filter components affect chart results on the current sheet only.
Create charts
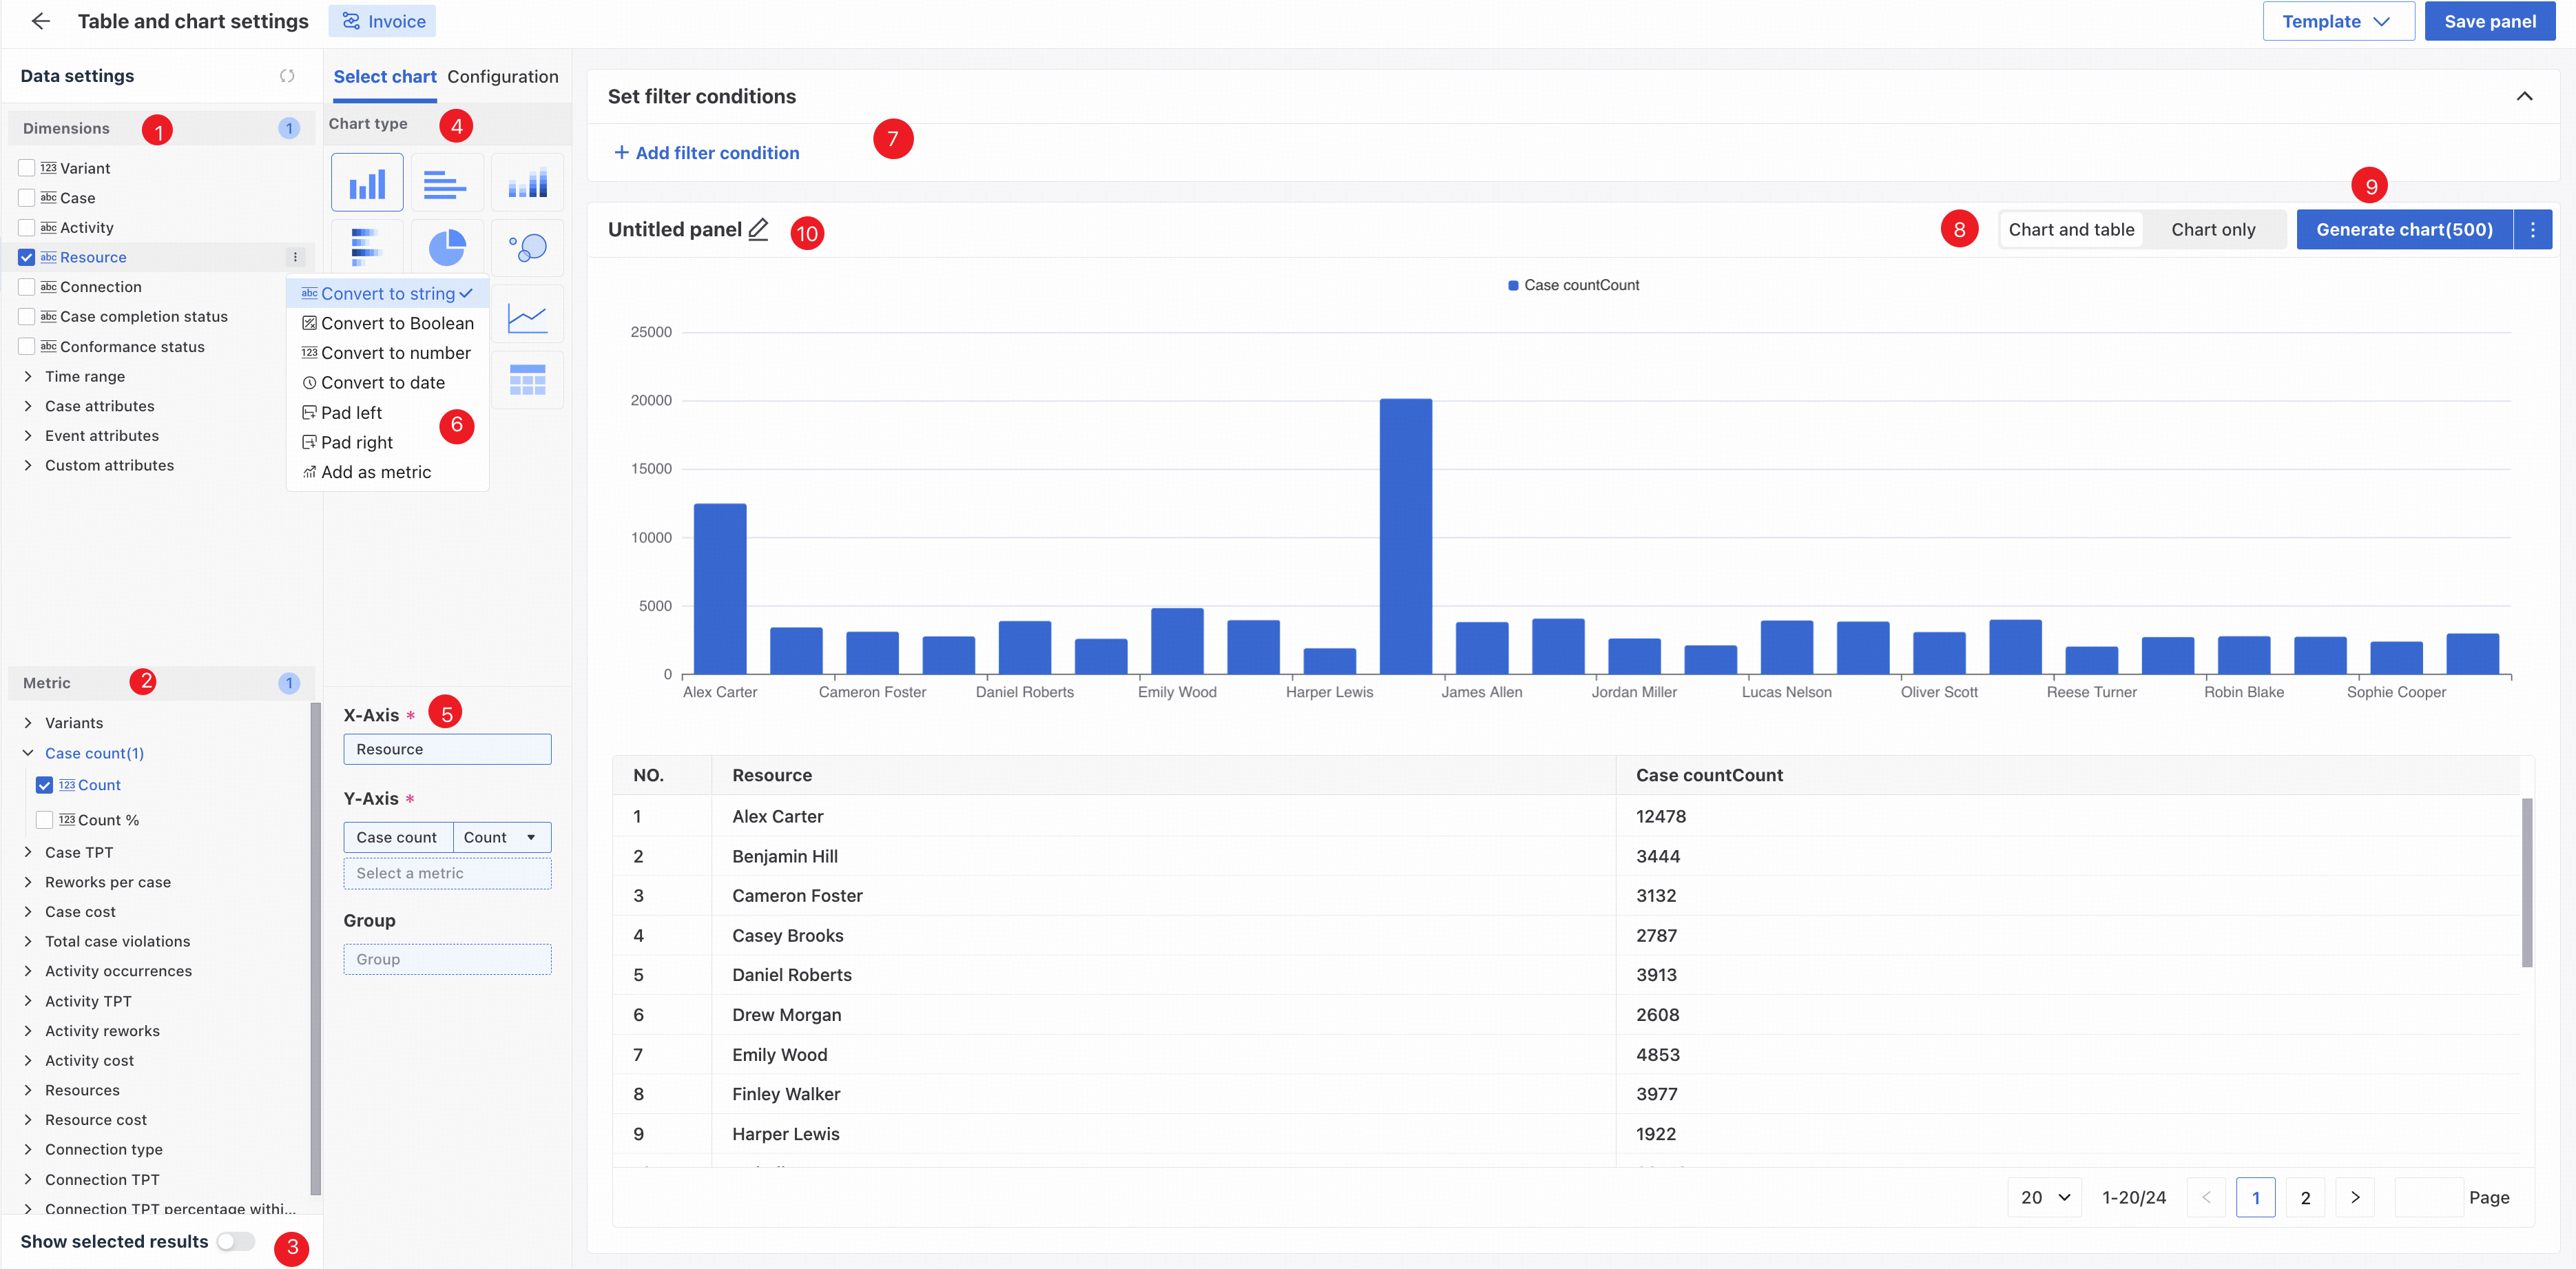
❶ Select chart dimensions using checkboxes or drag and drop.
❷ Select chart measures using checkboxes or drag and drop.
❸ Switch between showing selected items only and all measures and dimensions.
❹ Choose from 14 chart types:
- Vertical bar chart
- Pie chart
- Horizontal bar chart
- Line chart
- Area chart
- Scatter plot
- Single value
- Table
- Stacked chart
- Horizontal stacked chart
- Gauge chart
- Heatmap
- Bubble chart
- Box plot
Dimensions are optional for a single-value chart.
❺ View and edit selected dimensions, measures, and groups. Drag items to change their order or placement.
❻ Custom measures and dimensions.
Click the actions button next to a dimension to add a custom measure or dimension.
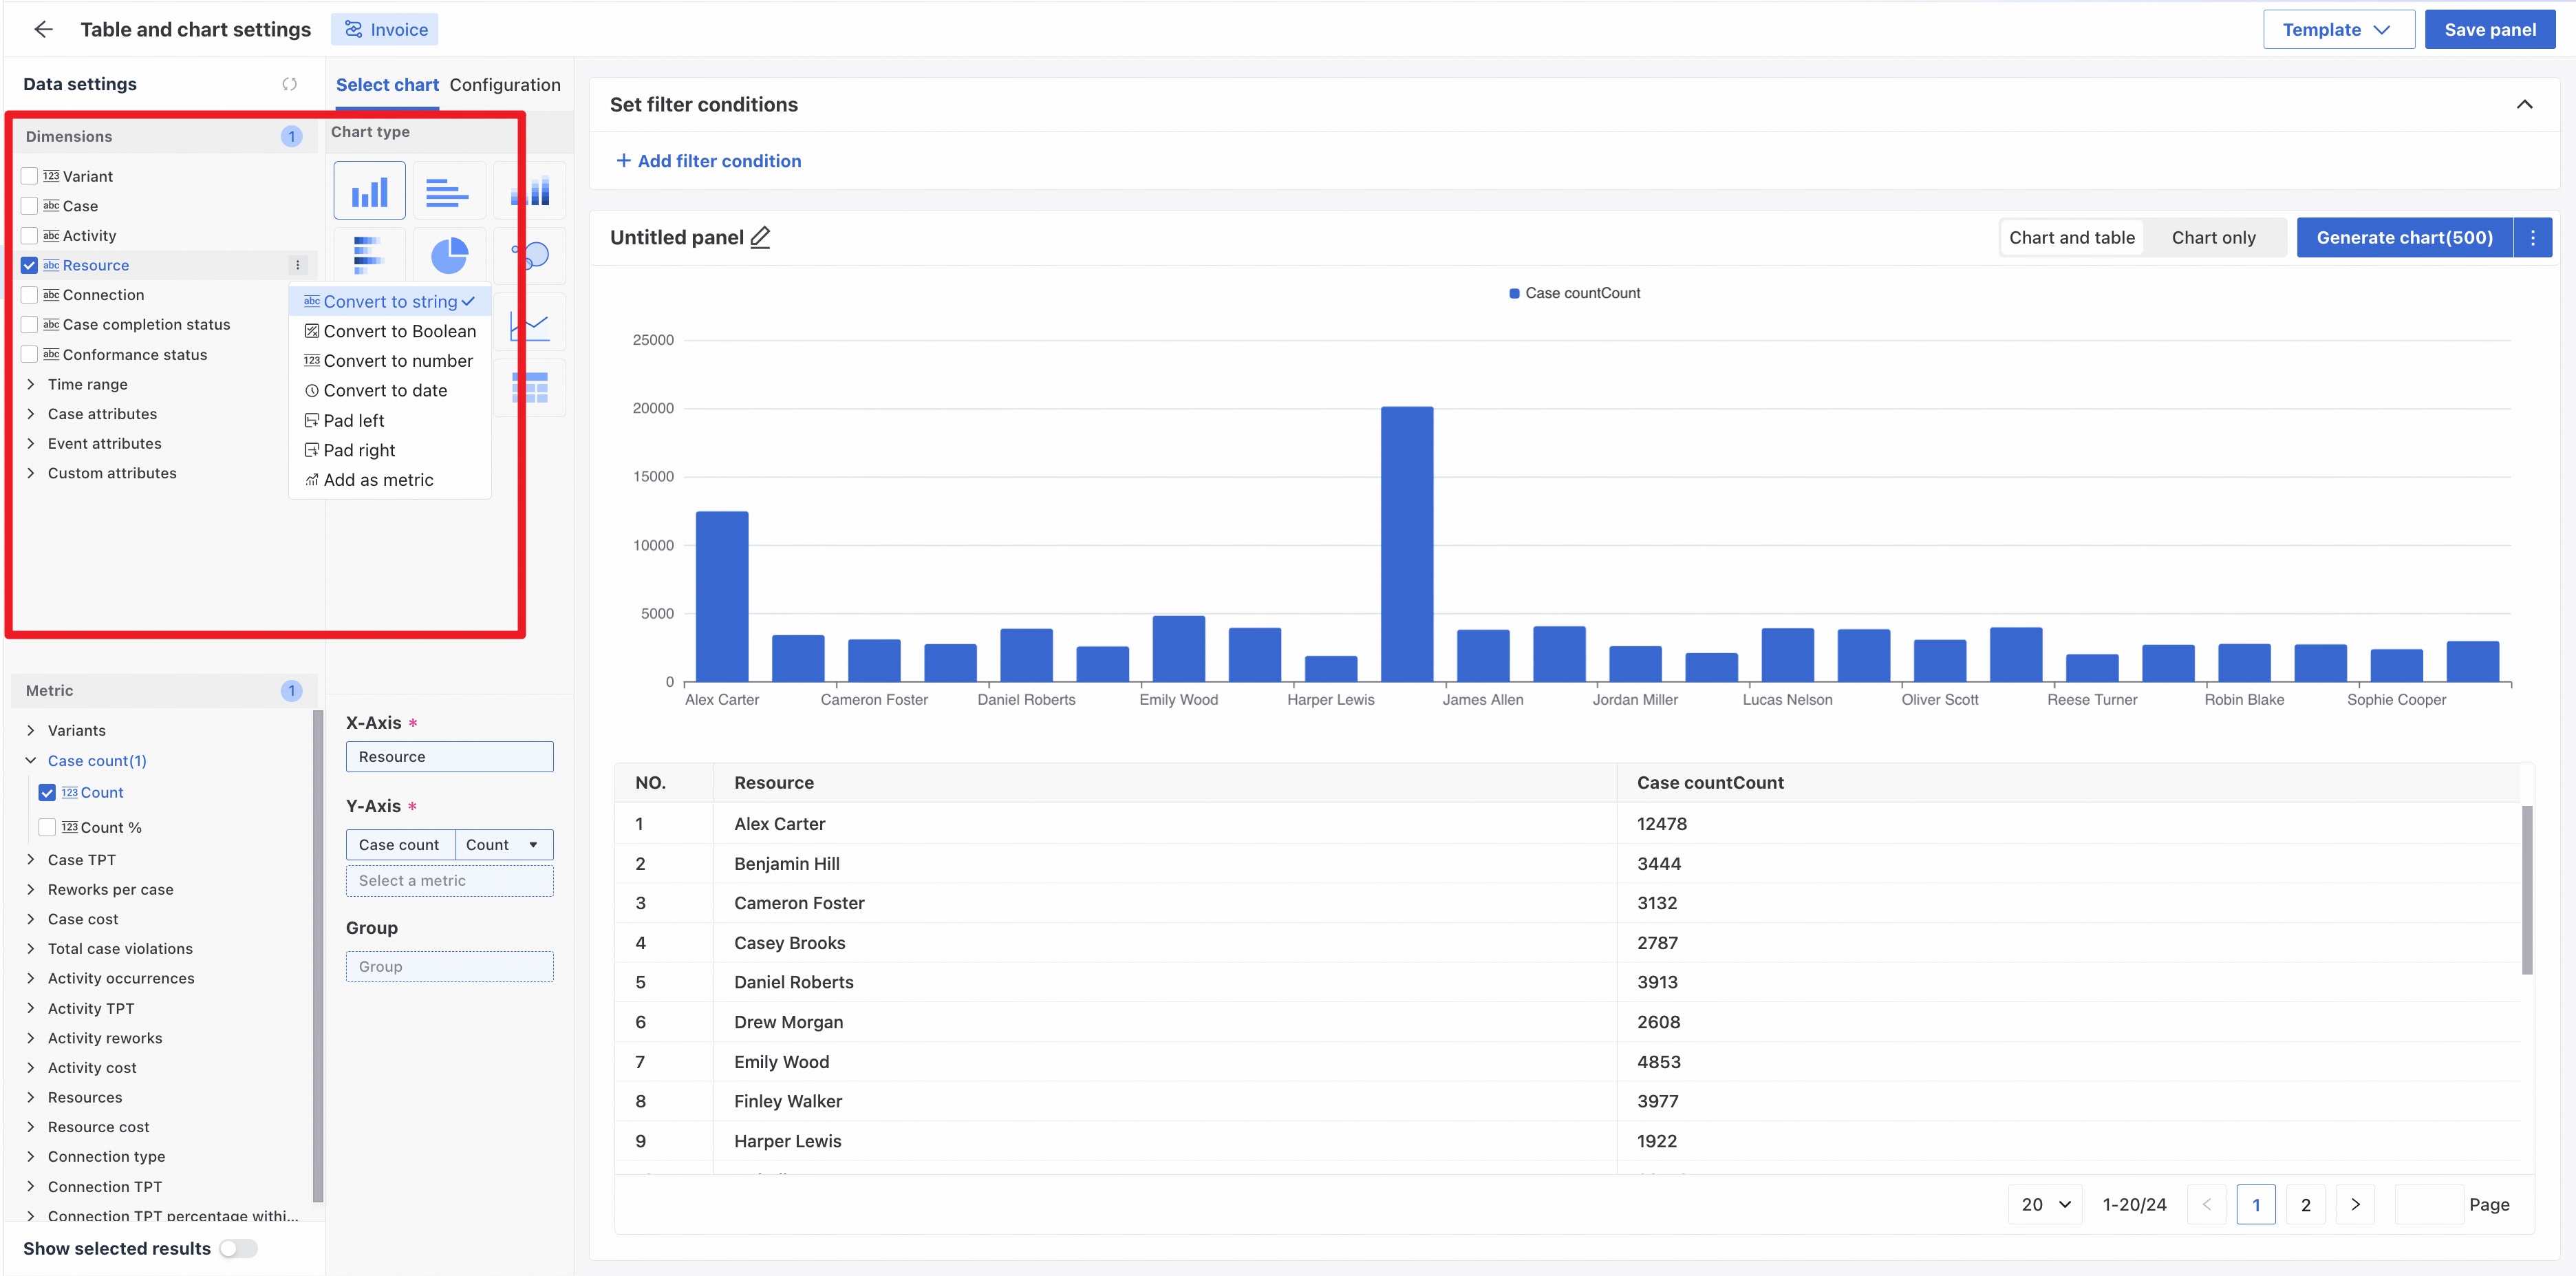
The current attribute's data type is selected by default.
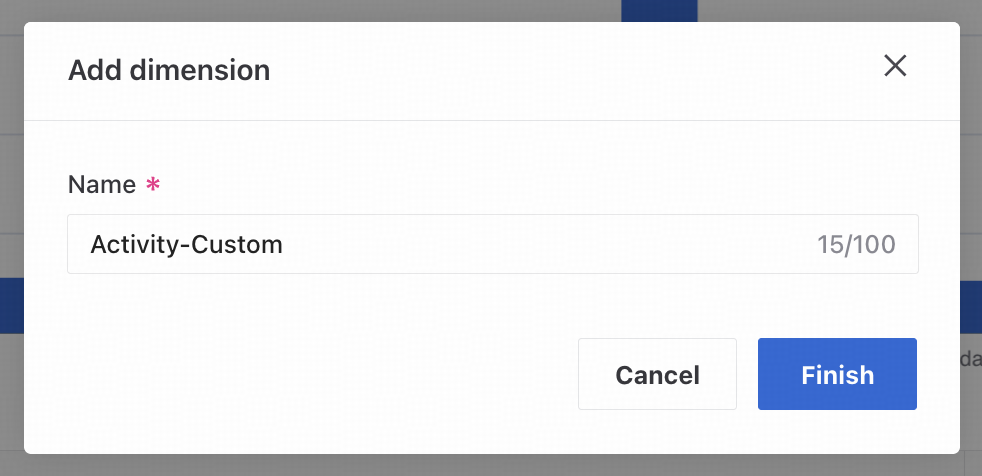
Select Convert to string, number, or Boolean, enter a custom dimension name, then confirm to create a dimension of that type.
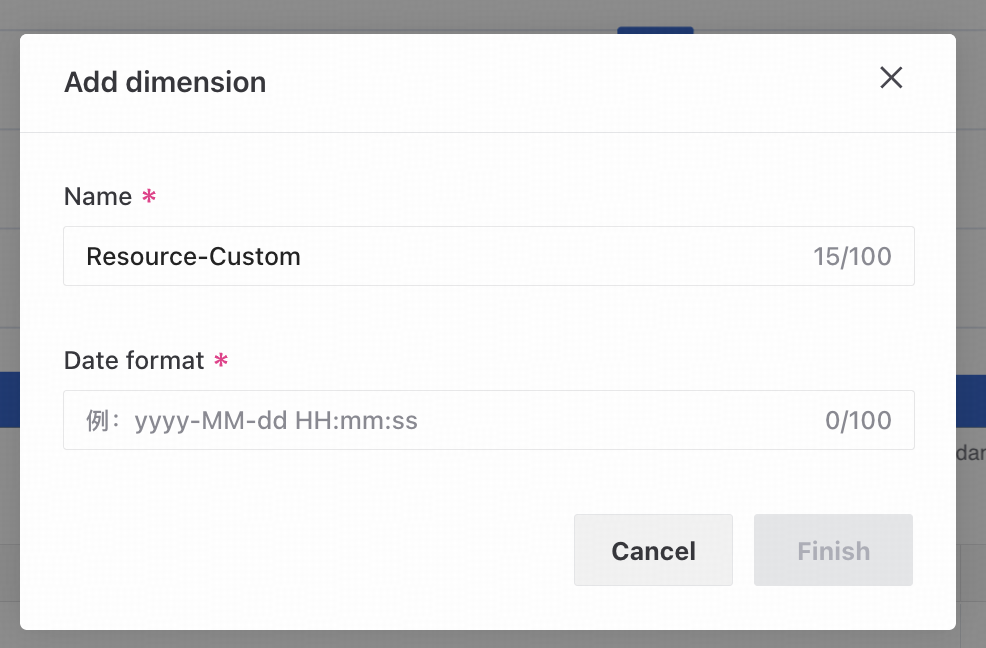
Select Convert to date, enter a custom dimension name and date format, then confirm to create a date dimension.
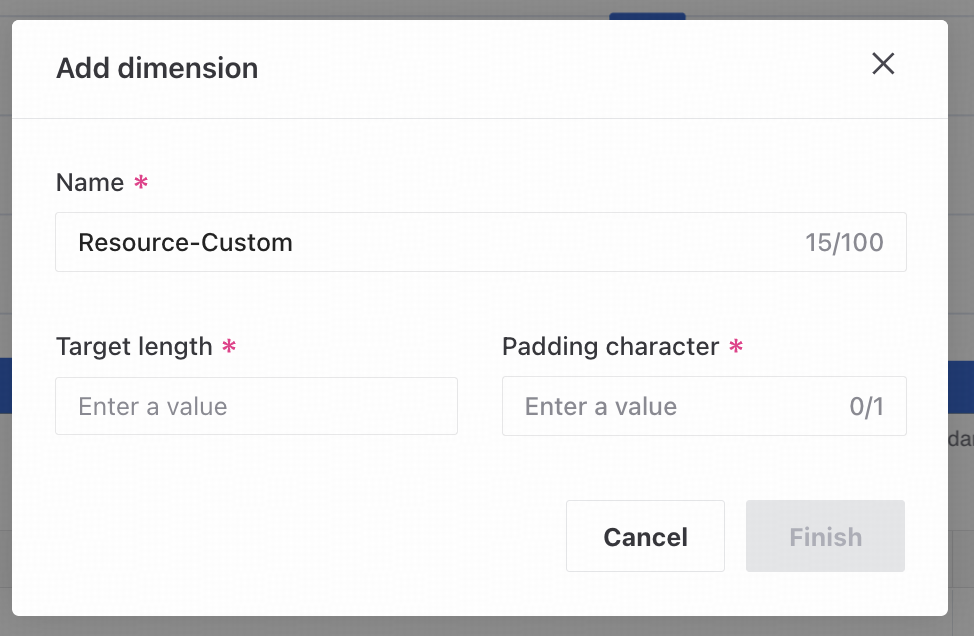
Select Pad left or Pad right, enter a custom dimension name, target length, and one padding character, then confirm to create the dimension.
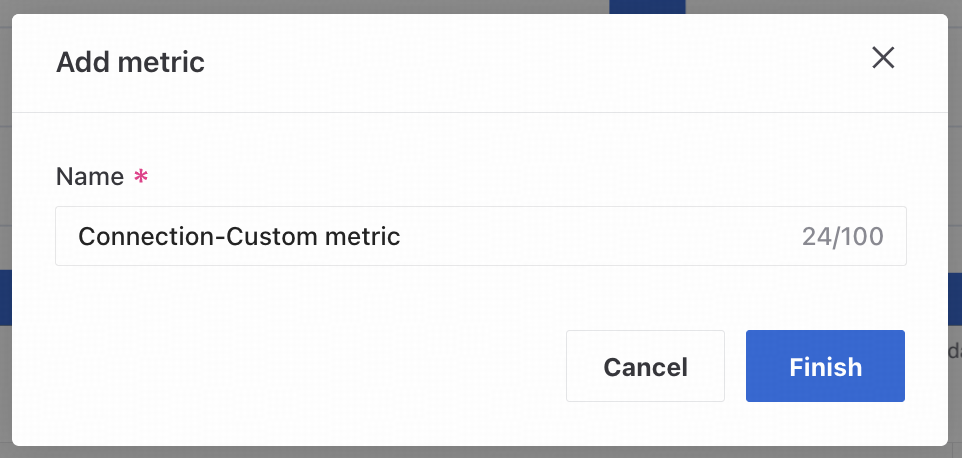
Select Add as measure, enter a custom measure name, then confirm to create the measure.
❼ Specify filters for the generated chart.
❽ Choose Chart only or Chart and table.
❾ After configuring the settings, click Generate chart. Regenerate the chart whenever measures, dimensions, or filters change.
The actions button next to Generate chart sets the number of data rows to generate, from 0 to 5,000.
❿ Enter the panel name to display in the insight.
After completing all settings, click Save panel to add the chart to the insight.
Chart configuration
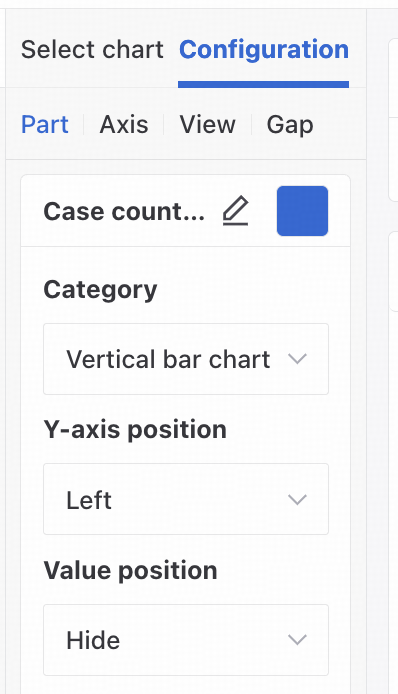
Open the Chart configuration tab to configure options for the selected chart type.
Templates
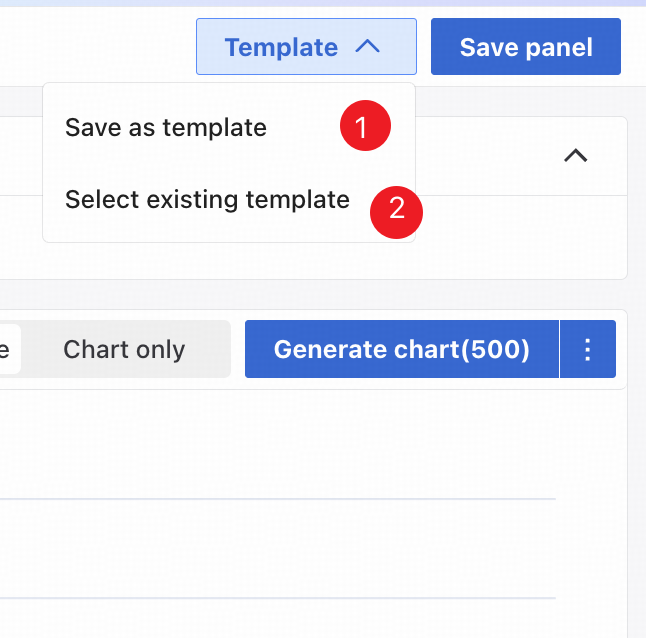
❶ Save the current chart as a template for this process.
❷ Select an existing template or a system preset to import a chart template quickly.
An insight is saved only after you click New insight, name it, or click Save.